> ## Documentation Index
> Fetch the complete documentation index at: https://docs.ntop.com/llms.txt
> Use this file to discover all available pages before exploring further.
# Creating Point Maps
#### **Creating a Point Map from nTop Simulation Results**
*Note: **Point Map** is used only for visualization with a HUD, which lets you see the values by controlling parameters on the HUD. You can use the field to drive your design parameters, which will be discussed in the later lessons.*
When you view an analysis's properties in nTop, you can see that different results are available as scalar fields.
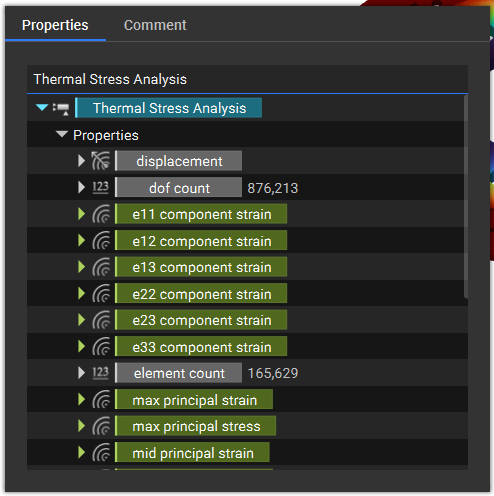
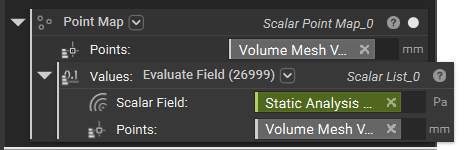
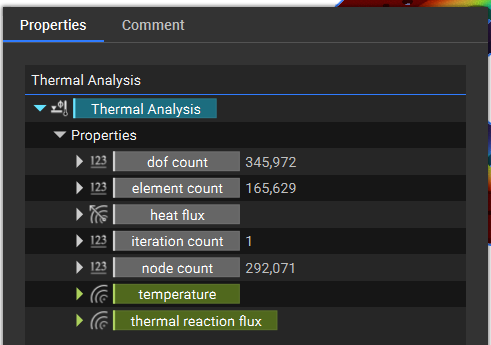 Add a **Point Map** block. We can see that it has two inputs: Points and Values.
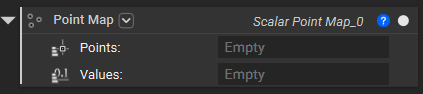 We will use a combination of the **Evaluate Field**block and nodes to calculate the field values in the node values and then use them as input to the **Point Map** block.
For an example, let's use the von misses stress property of the **Static Analysis** block.
*Points: FE Volume Mesh > volume mesh > vertices*
*Evaluate Field: Scalar Field: Static Analysis > von misses stress*
We will use a combination of the **Evaluate Field**block and nodes to calculate the field values in the node values and then use them as input to the **Point Map** block.
For an example, let's use the von misses stress property of the **Static Analysis** block.
*Points: FE Volume Mesh > volume mesh > vertices*
*Evaluate Field: Scalar Field: Static Analysis > von misses stress*
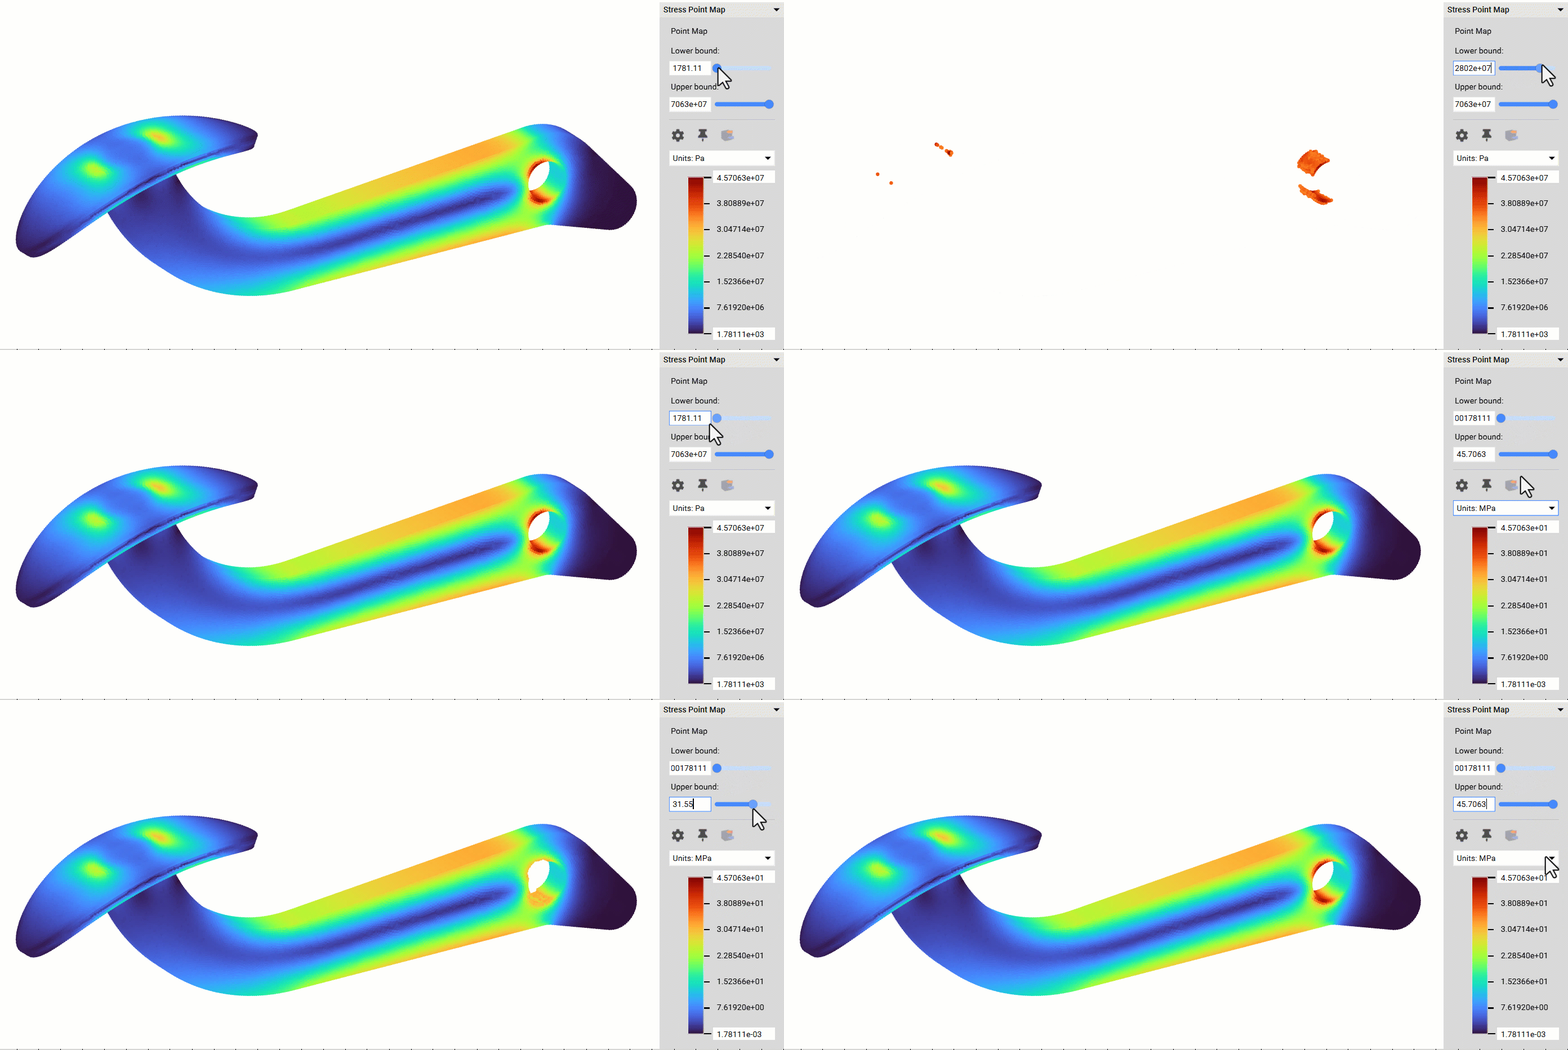
 This generates a Point Map of the Von Mises stress. You can toggle the Lower and Upper Bounds of the Point Map when visible. The Point Map is the stepping stone to utilizing the Simulation results. It can be exported, filtered to show the max or min values, and used to create a Field for further design changes.