> ## Documentation Index
> Fetch the complete documentation index at: https://docs.ntop.com/llms.txt
> Use this file to discover all available pages before exploring further.
# Evaluate Results
After the **Flow Analysis** block runs, you can evaluate your results using the Right Side Panel, heads-up display, and display block.
## Results Display
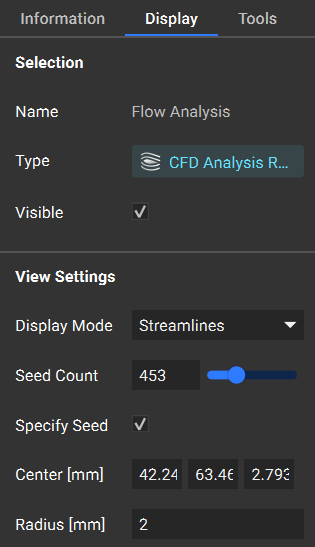
Use the *Display* tab in the Right Side Panel control how you view results. You can toggle the *Display Mode* to visualize the results as a color gradient as a domain or as individual streamlines. These streamlines are calculated on the time averaged velocity results.
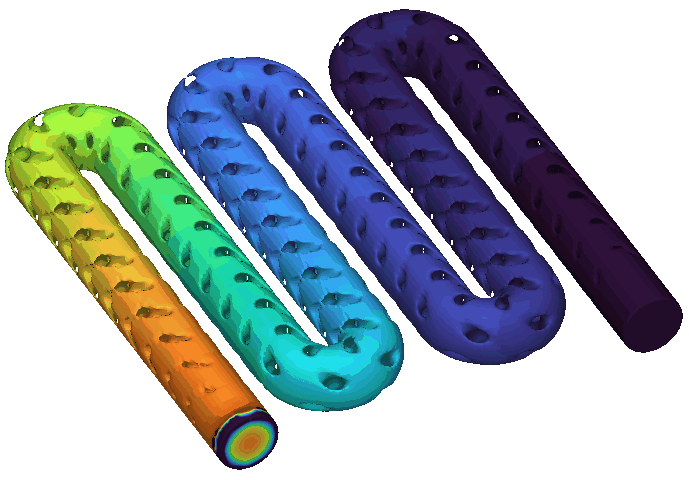
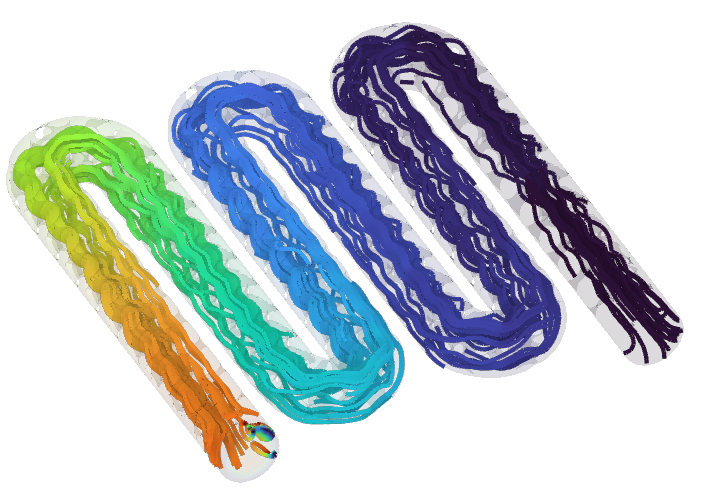
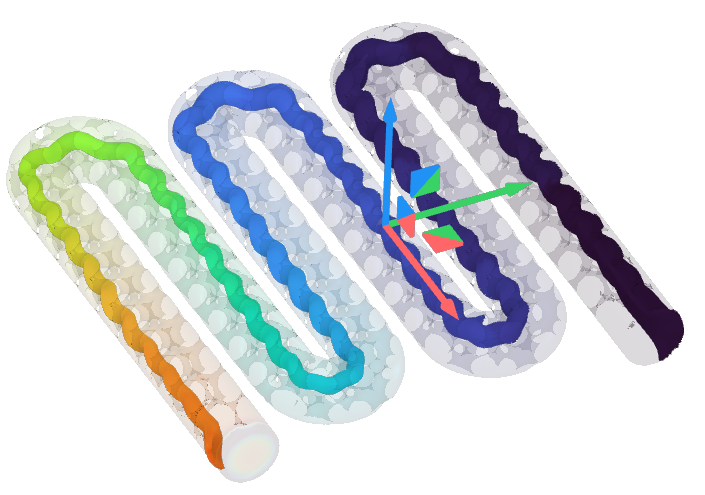
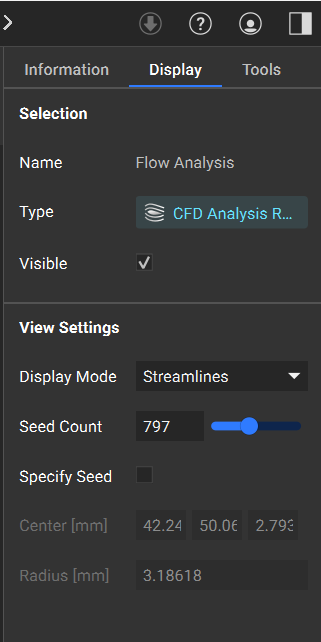 Say, when displaying results as streamlines, you want to see how fluid behaves in a specific region. Check *Specify Seed* to define a region, and visualize the upstream and downstream behavior of only the fluid that passes through the specified region. You can imagine this as placing a drop of dye into a specific location to visualize its behavior in your domain.
 ## View CFD Results
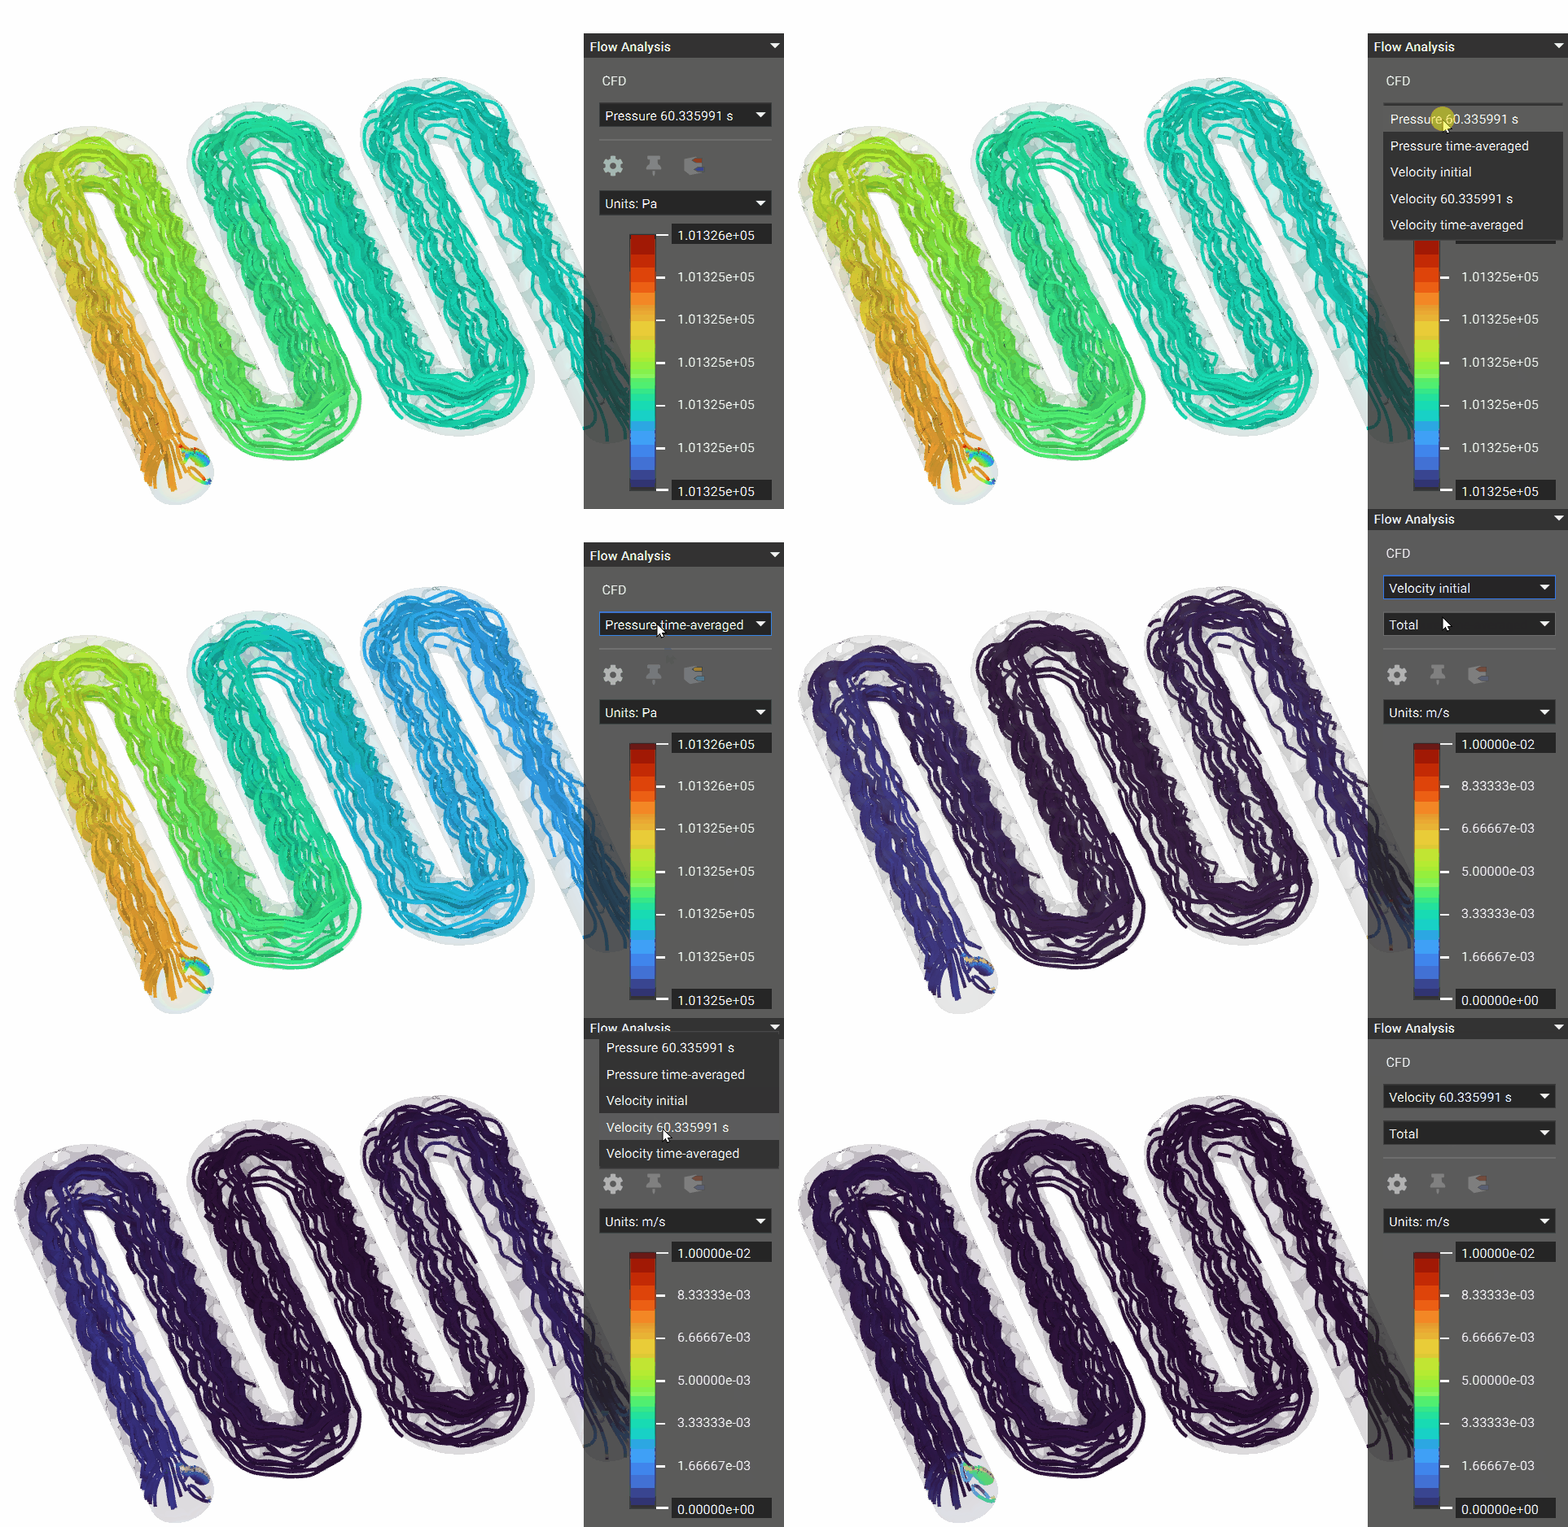
Used the heads-up display to view the initial, instantaneous, and time-averaged pressures and velocities.
* **Instantaneous** results show the results at the moment the analysis reaches a statistically steady state.
* **Time-Averaged** results show averaged velocity and pressure throughout the analysis.
## View CFD Results
Used the heads-up display to view the initial, instantaneous, and time-averaged pressures and velocities.
* **Instantaneous** results show the results at the moment the analysis reaches a statistically steady state.
* **Time-Averaged** results show averaged velocity and pressure throughout the analysis.
 ## Flow Analysis Results on Boundary
To evaluate results on a specific boundary , you can use the **Flow Analysis Results on Boundary** block.
## Flow Analysis Results on Boundary
To evaluate results on a specific boundary , you can use the **Flow Analysis Results on Boundary** block.
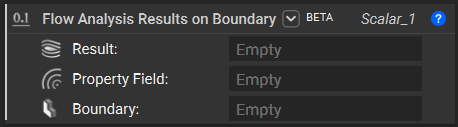 Specify the *Result* you want to evaluate (this is simply the **Flow Analysis** block) and the *Boundary* of interest. Note this boundary must reference the same virtual domain as the flow analysis simulation model.
To define the *Property Field* to evaluate, open the flow analysis properties and expand the property (velocity or pressure) of interest. In the list elements of *keys*, you will see the descriptions of each key. Then, expand the *values*, and drag the associated property chip from its list elements to the *Property Field* input.
Specify the *Result* you want to evaluate (this is simply the **Flow Analysis** block) and the *Boundary* of interest. Note this boundary must reference the same virtual domain as the flow analysis simulation model.
To define the *Property Field* to evaluate, open the flow analysis properties and expand the property (velocity or pressure) of interest. In the list elements of *keys*, you will see the descriptions of each key. Then, expand the *values*, and drag the associated property chip from its list elements to the *Property Field* input.
 In this example, we want to evaluate the time-averaged pressure at the inlet boundary. Within the flow analysis pressure properties, *keys \[2]* indicates “pressure time averaged”, so we use *values \[2]* as our *Property Field* input.