Results Display
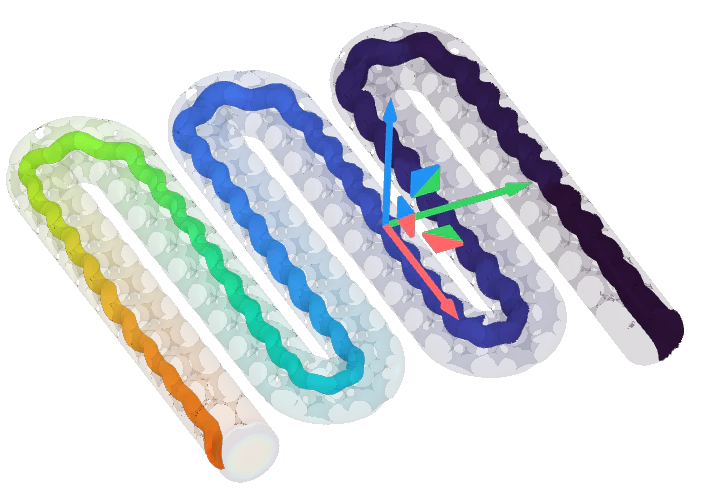
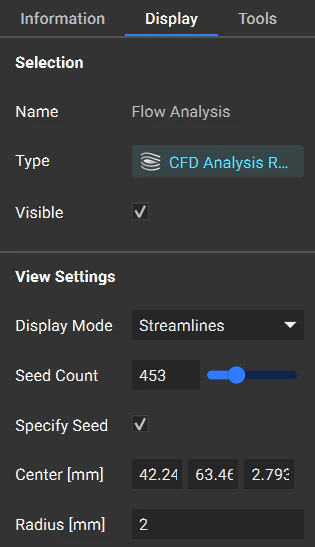
Use the Display tab in the Right Side Panel control how you view results. You can toggle the Display Mode to visualize the results as a color gradient as a domain or as individual streamlines. These streamlines are calculated on the time averaged velocity results.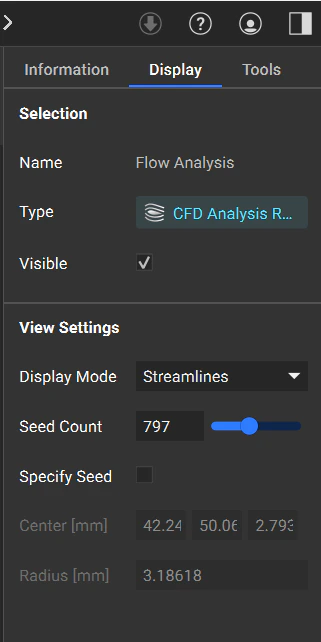
View CFD Results
Used the heads-up display to view the initial, instantaneous, and time-averaged pressures and velocities.- Instantaneous results show the results at the moment the analysis reaches a statistically steady state.
- Time-Averaged results show averaged velocity and pressure throughout the analysis.

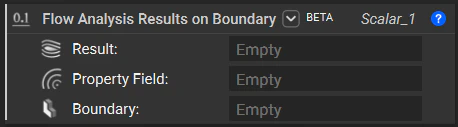
Flow Analysis Results on Boundary
To evaluate results on a specific boundary , you can use the Flow Analysis Results on Boundary block.