Objective:
How to find the maximum and minimum stress valuesApplies to:
- Static Analysis
Procedure:
- Run a Static Analysis(How to run a static analysis)
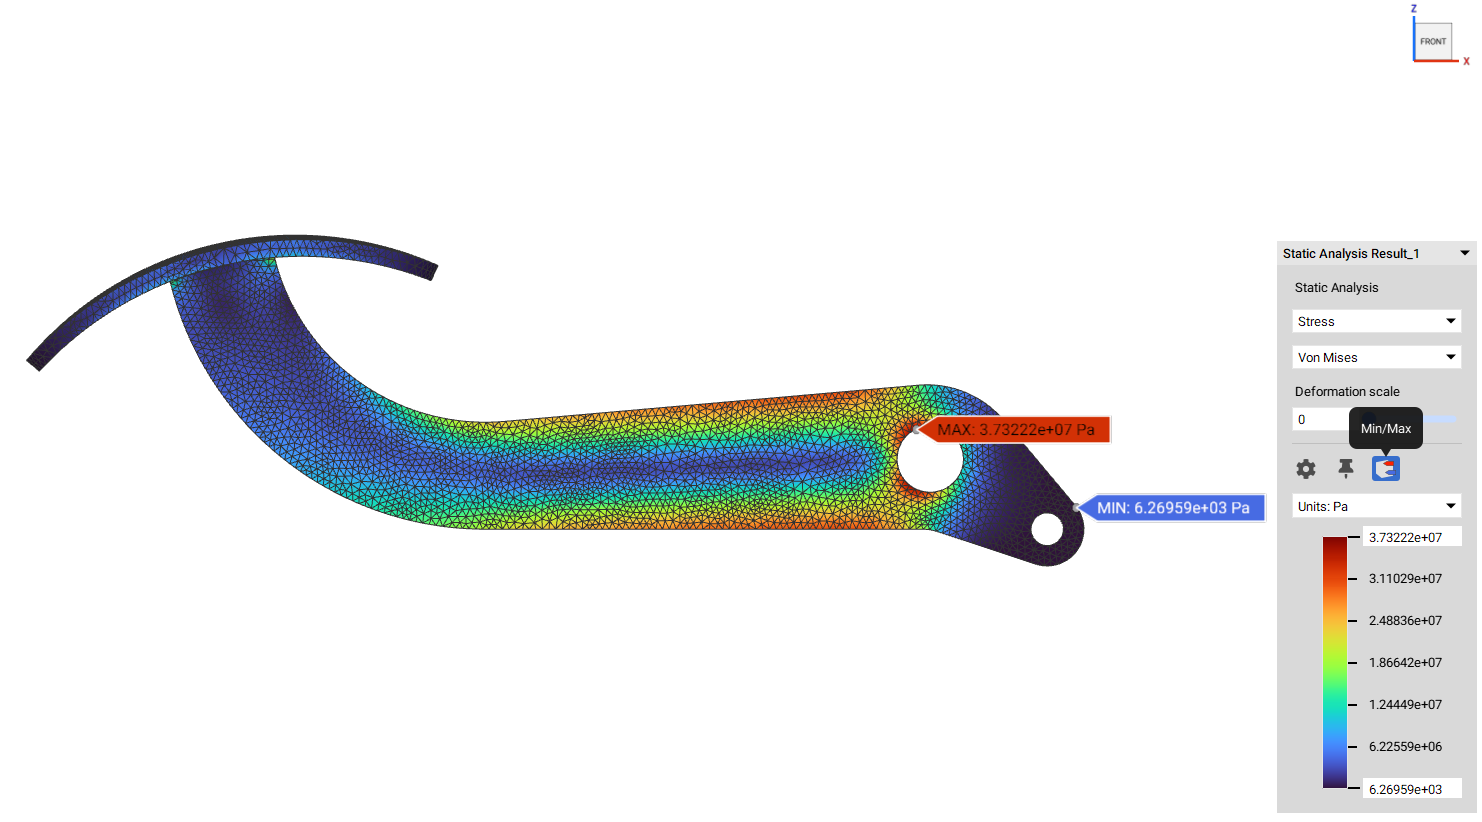
- Click the Min and Max icon in the HUD to enable tags. When visibility is toggled on for any simulation analysis blocks, you can quickly identify the location of minimum and maximum values by selecting the “Min/Max” icon in the HUD. The location of the minimum value will be automatically identified with a blue tag, while the maximum value will be identified with a red tag.
- Alternatively, Insert a Von Misses Stress Point Mapblock, drag and drop the Static Analysis from the previous step in the “Analysis result:” field. Now use the Min and Max blocks and drag and drop the values scalar list from the stress point map.
 And that’s it! You’ve successfully found out the maximum and minimum stress values.
Are you still having issues? Contact the support team, and we’ll be happy to help!
And that’s it! You’ve successfully found out the maximum and minimum stress values.
Are you still having issues? Contact the support team, and we’ll be happy to help!