
1. Notebook
1. Notebook
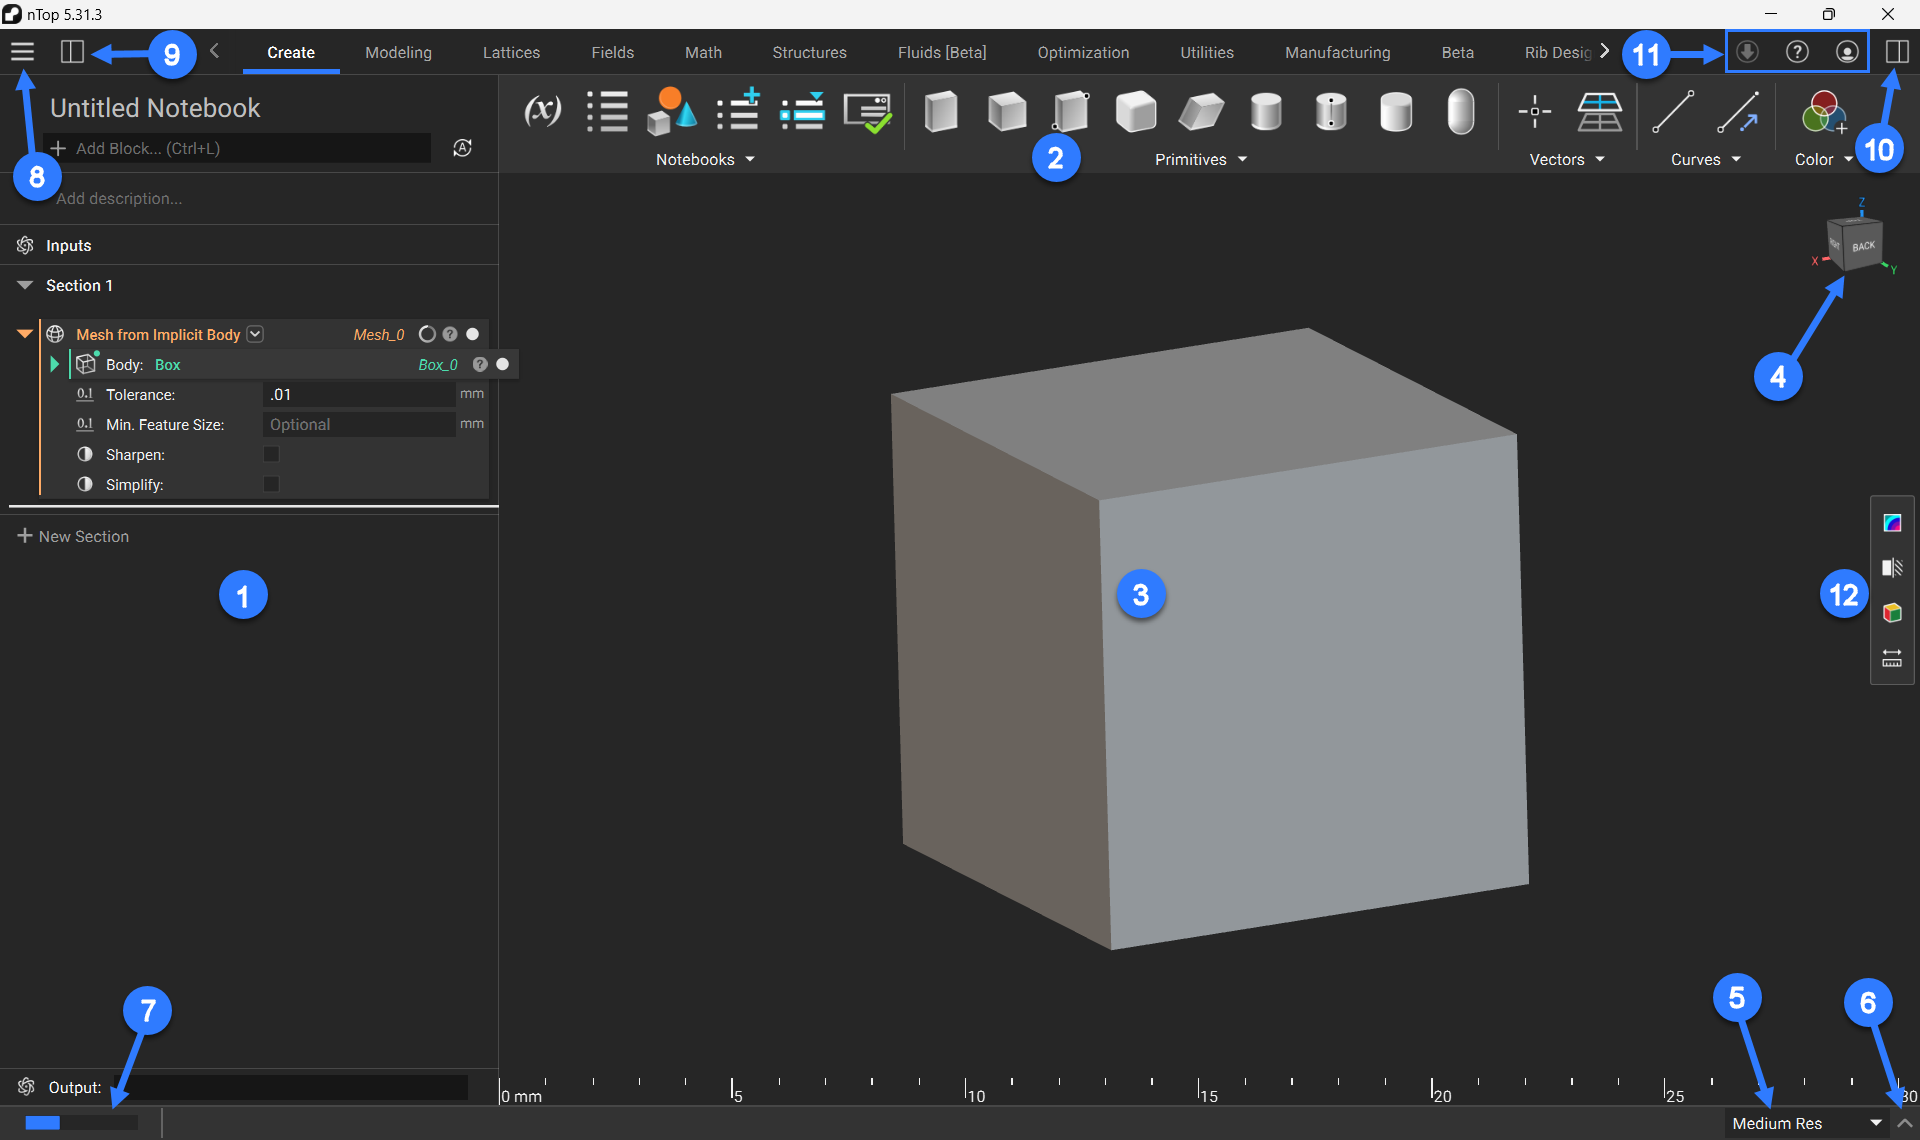
The notebook on the left keeps a record of your modeling operations. You will work entirely within this notebook to build your workflow and manipulate the design parameters of your parts. The notebook allows you to: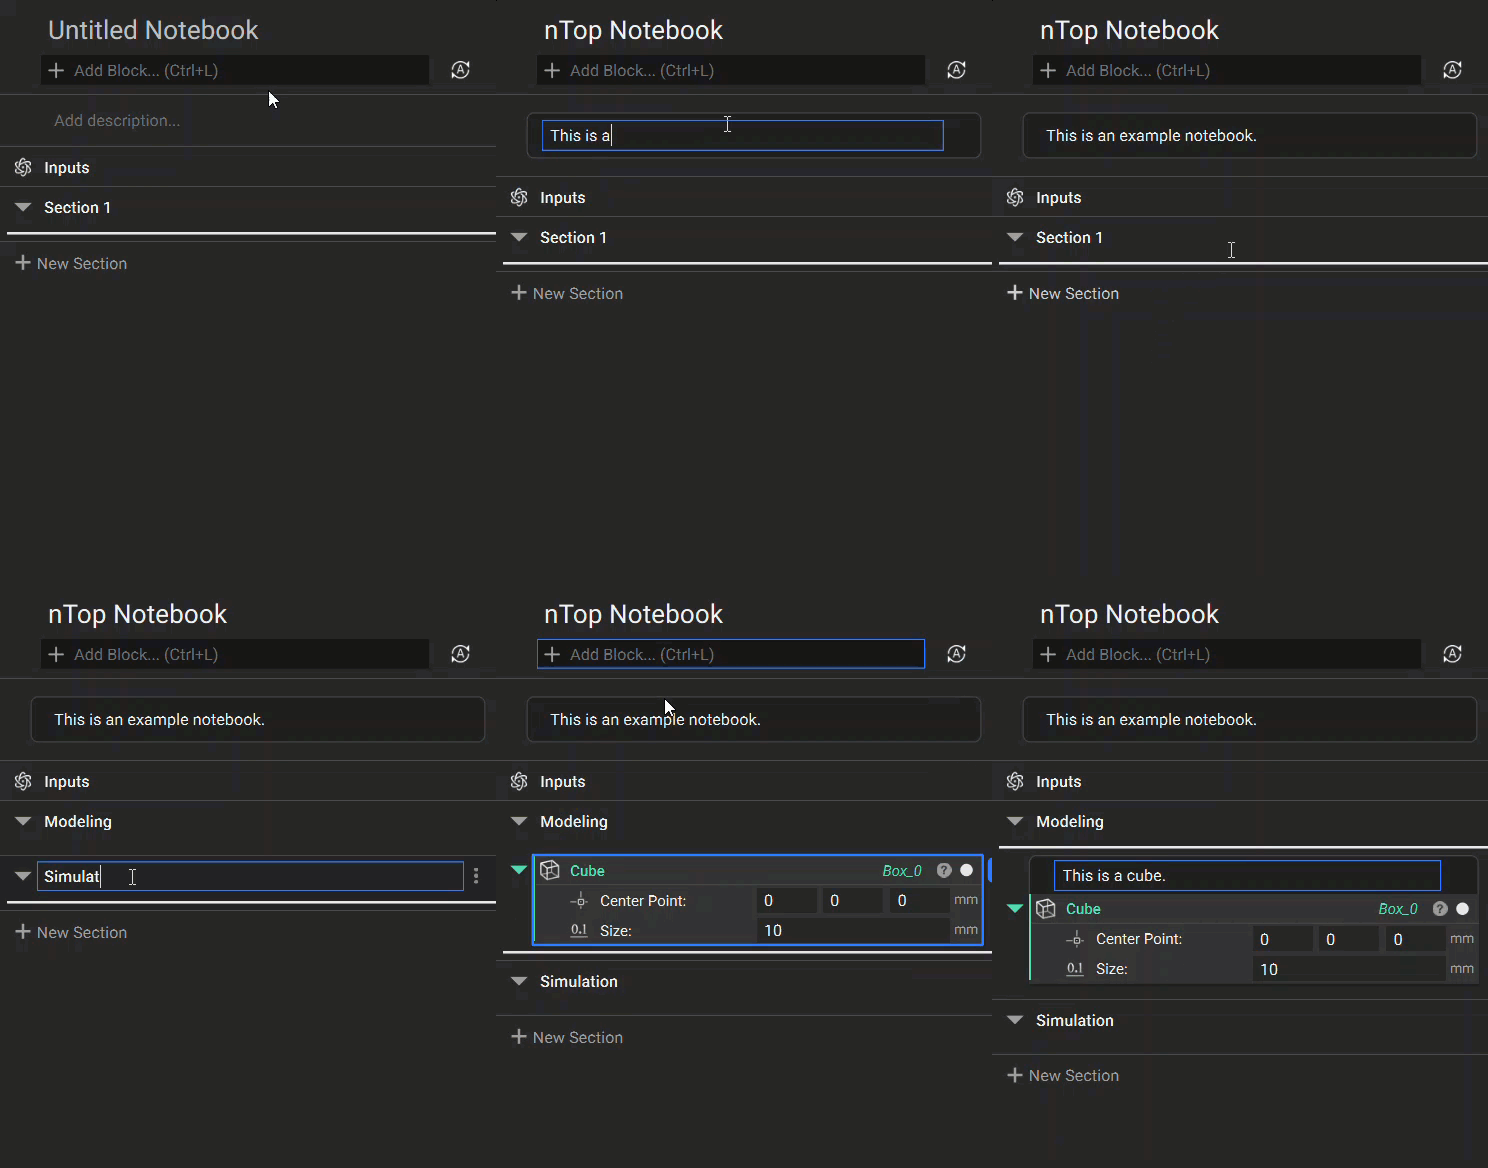
- Title your notebook
- Add a notebook description
- Create/Rename sections to organize your notebook
- Use the search bar to quickly find and add blocks
- Add comments to individual blocks
2. Ribbon
2. Ribbon
The ribbon contains blocks for performing different operations in nTop. You can navigate the ribbon by clicking on the tabs to change block menus. You can also use the arrows to reveal additional tabs.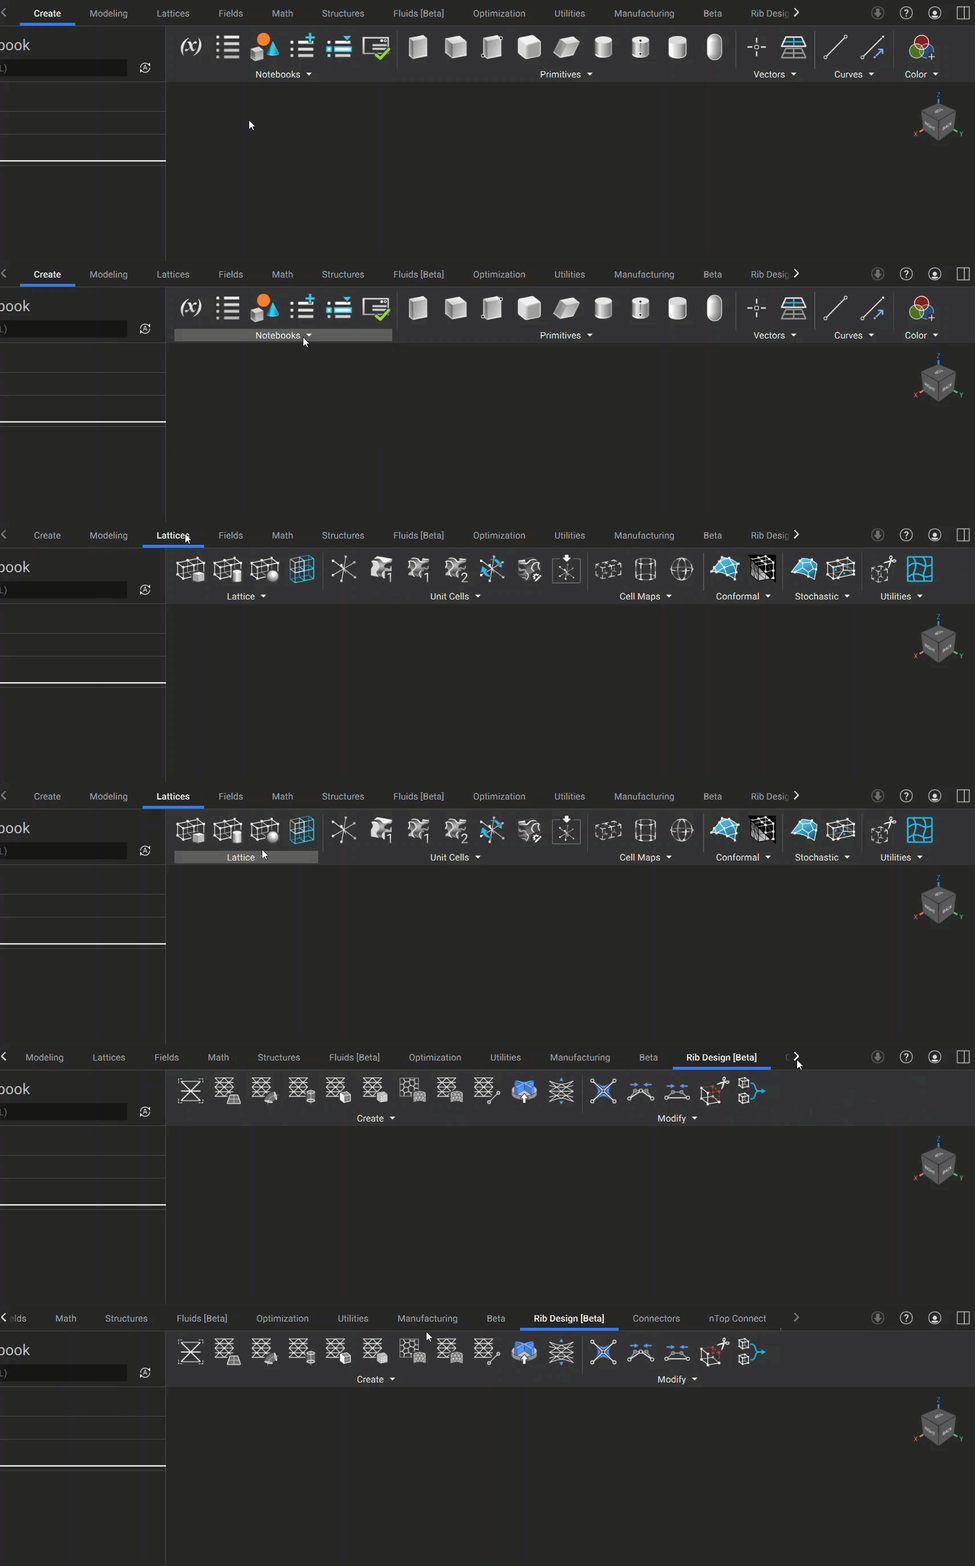 The ribbon tabs can be configured under: Menu>Settings>RibbonHere you can toggle which tabs of the ribbon are visible in the nTop instance by turning on/off the checkboxes.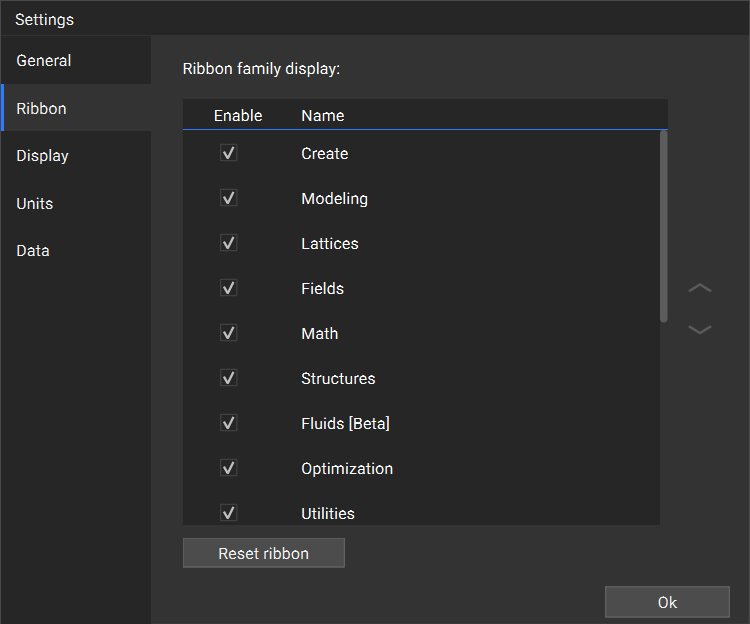
3. Viewport
3. Viewport
The viewport is where you can see the visual rendering of the geometry you’ve created by working in the notebook. The main controls for operating in the viewport are: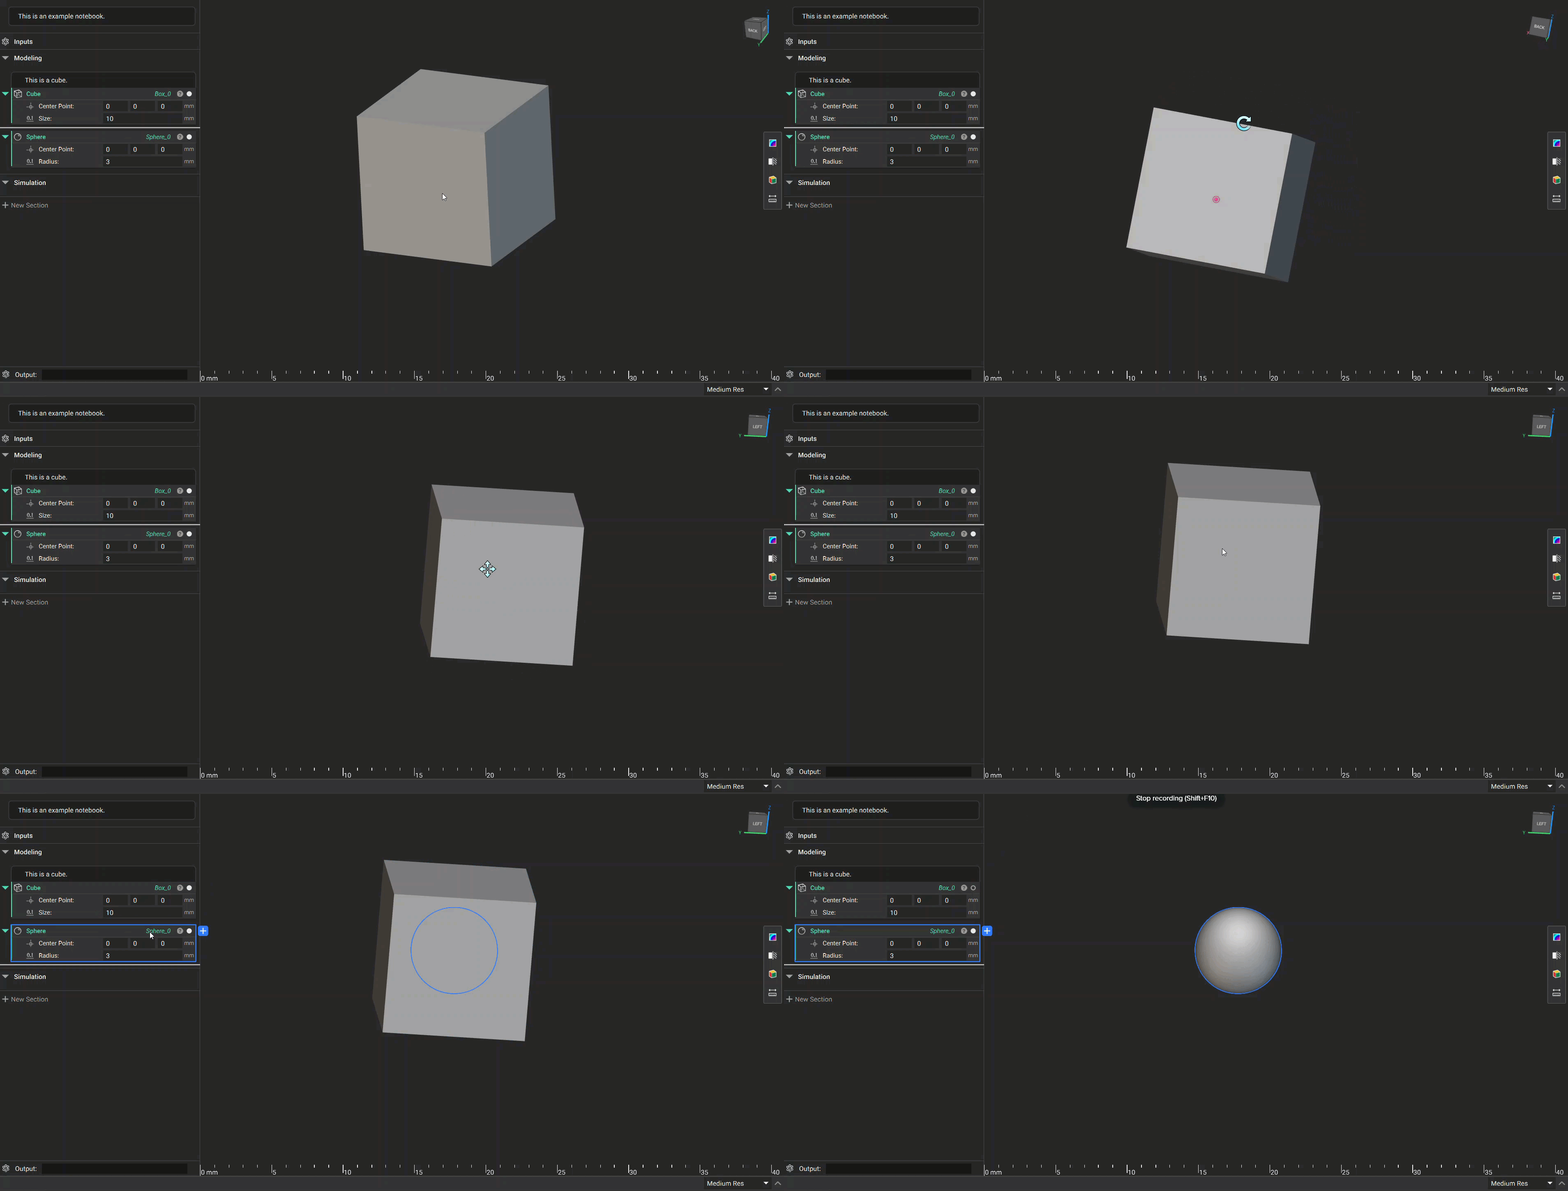
- Right Click: Press and hold right-click while moving your mouse to rotate
- Middle Mouse: Press and hold the middle mouse button to move
- Block Highlighting: Select a block from the notebook to highlight it in the notebook and viewport
- Toggle Block View: Toggle the white circle icon next to a block to turn on/off its visibility
4. View Cube
4. View Cube
The view cube shows the XYZ axis indication and has different options for viewing your geometry: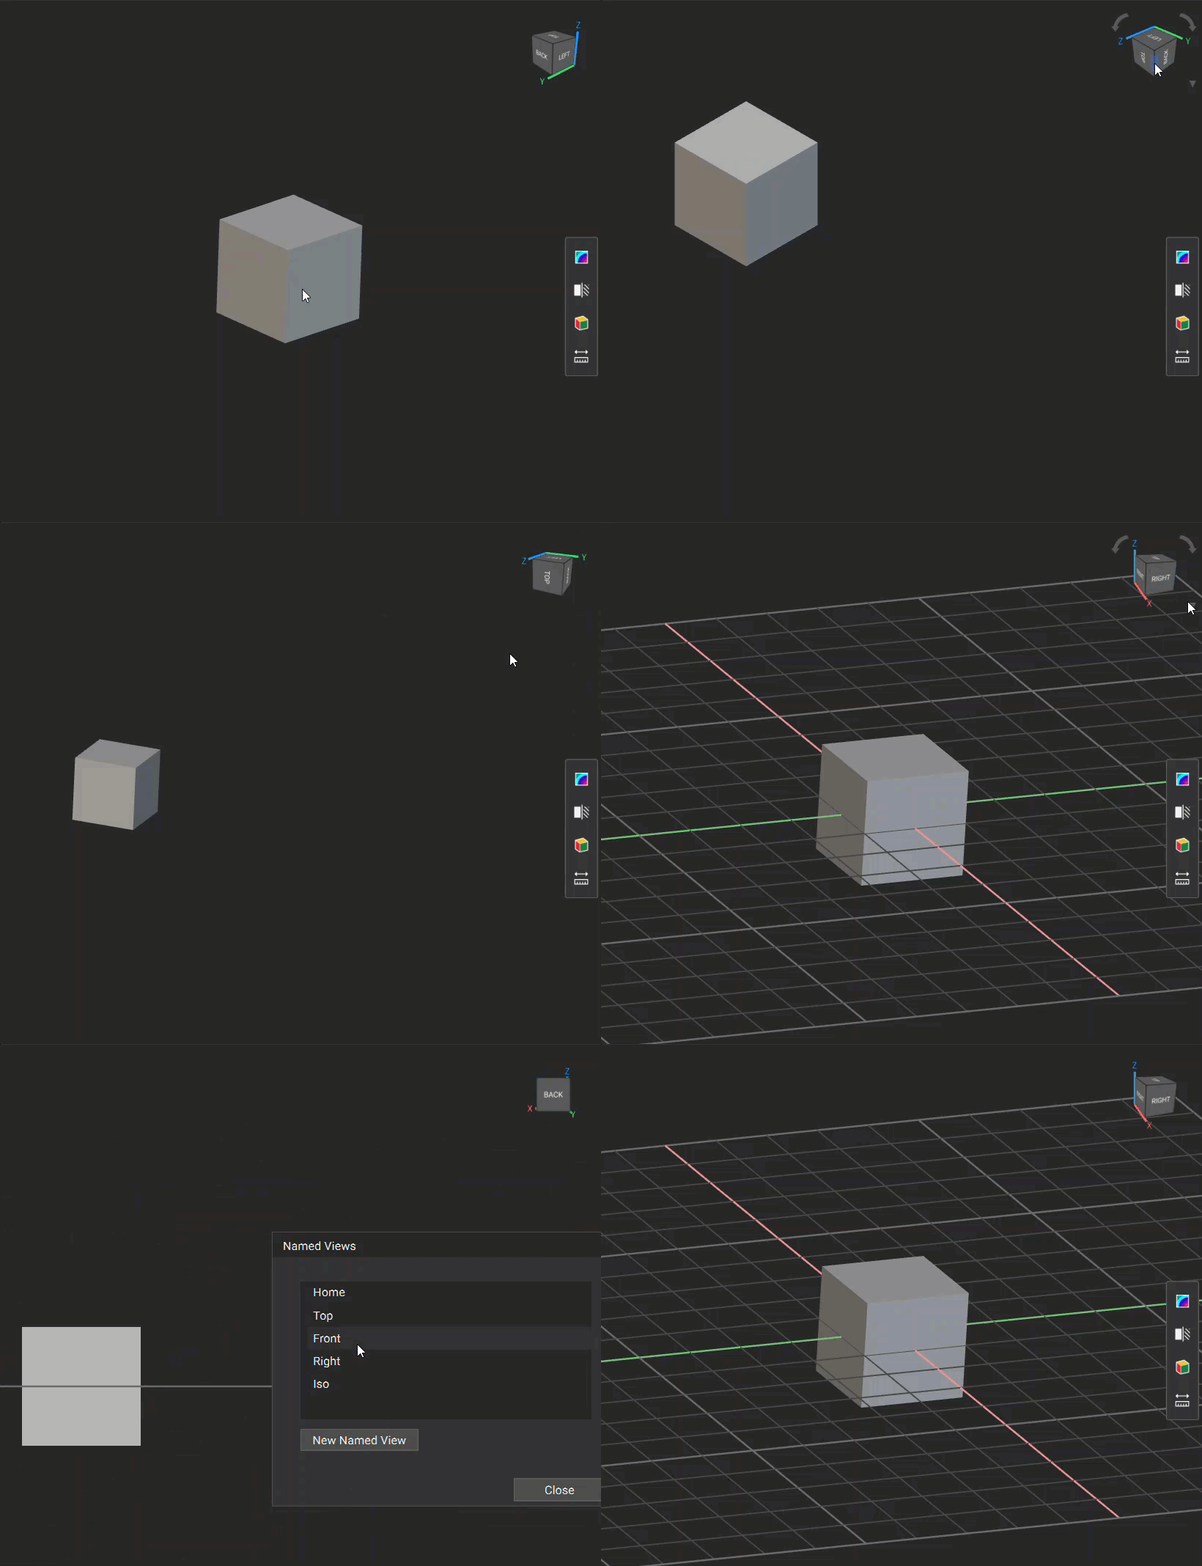
- Camera Settings: Choose to view your part in either Perspective or Orthographic. Note: The ruler is unavailable in Perspective view
- Rotation Setting: Choose between Turntable and Tumbler for how your part rotates in the viewport
- Show Grid: Toggle the grid on/off in the viewport
- Show Ruler: Toggle the ruler on/off in the viewport
- Named Views: Quickly jump between preset views or create your own view. To create your own, select “New Named View” when your part is oriented correctly and type in a name for the view.
- Capture Image: Use this tool to screenshot your geometry and save the image to your machine.
5. Resolution
5. Resolution
Resolution settings are located at the bottom right corner. We recommend working in low or medium res, and using high or highest res only to check your geometry. Changing the resolution only affects the loading time and the quality of the rendered image on the screen, not the actual part.
6. Log Panel
6. Log Panel
The arrow to the right of the resolution settings expands and collapses the Log Panel, which shows timestamps of your operations, as well as how long processes are taking to complete. You can jump to the most recent operation using the “Last” button, or you can clear the log using the “Clear” button.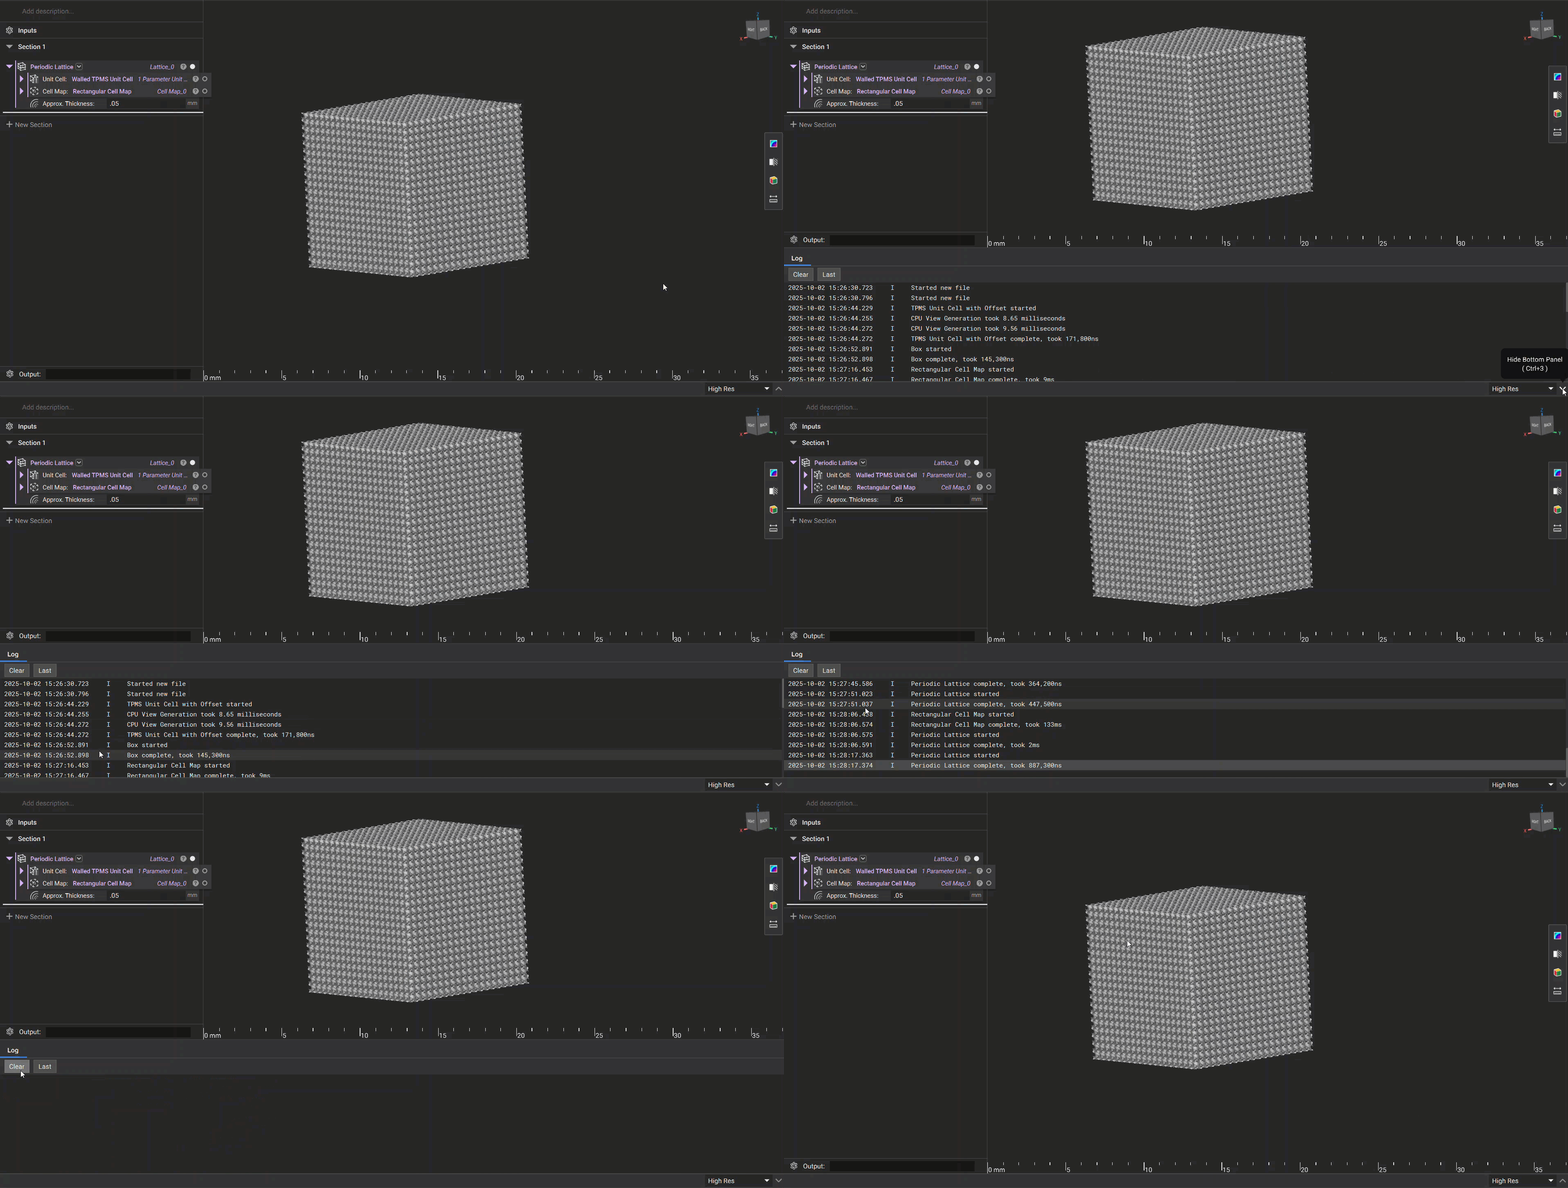
7. Status Bar
7. Status Bar
If a process is in progress, the Status Bar on the left side would appear. By hovering over it, you can see the related block’s name, the process being executed, and the percentage completion.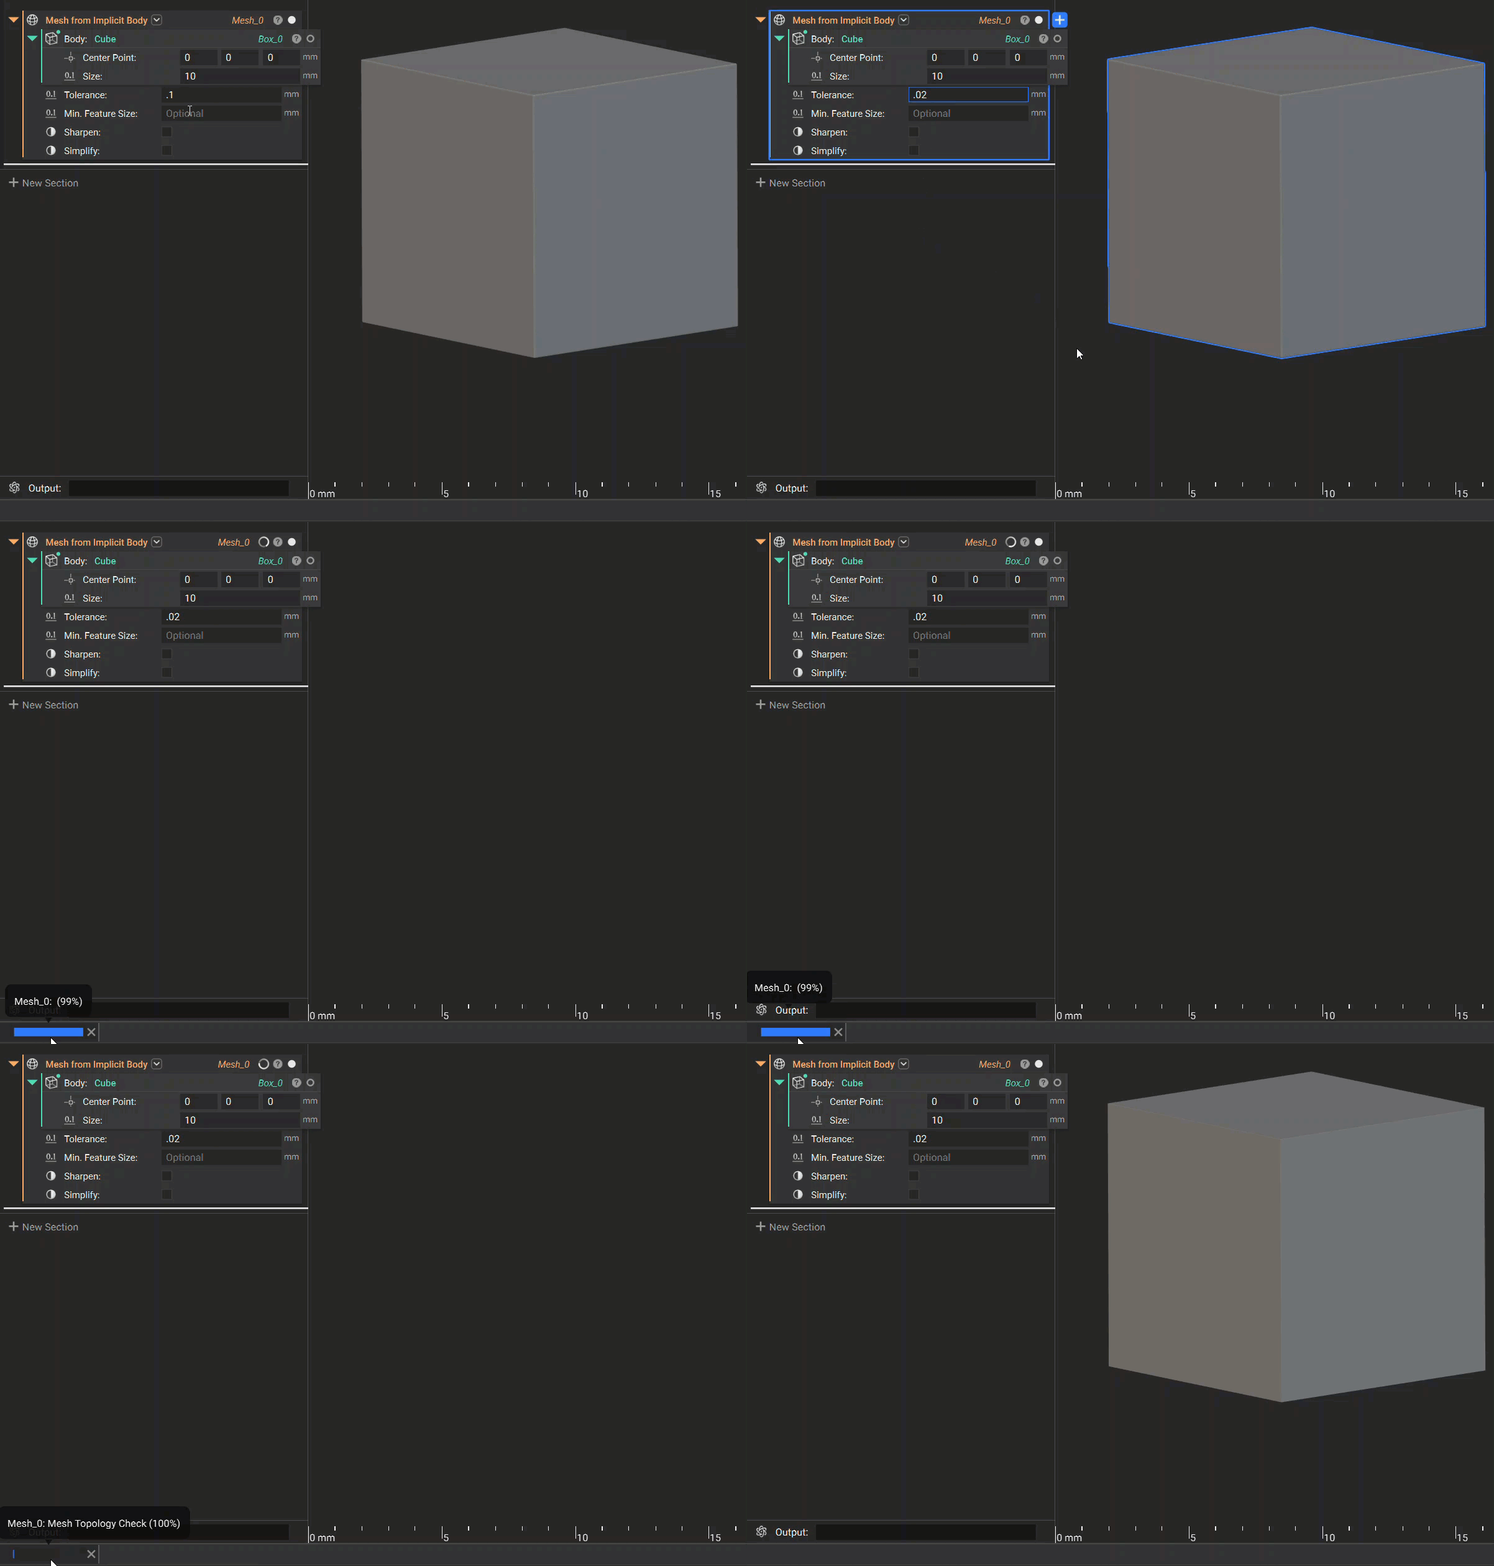
The Menu is located in the top left corner of the nTop window and can be opened by clicking the three horizontal lines button. This contains multiple operations that are divided into several sections: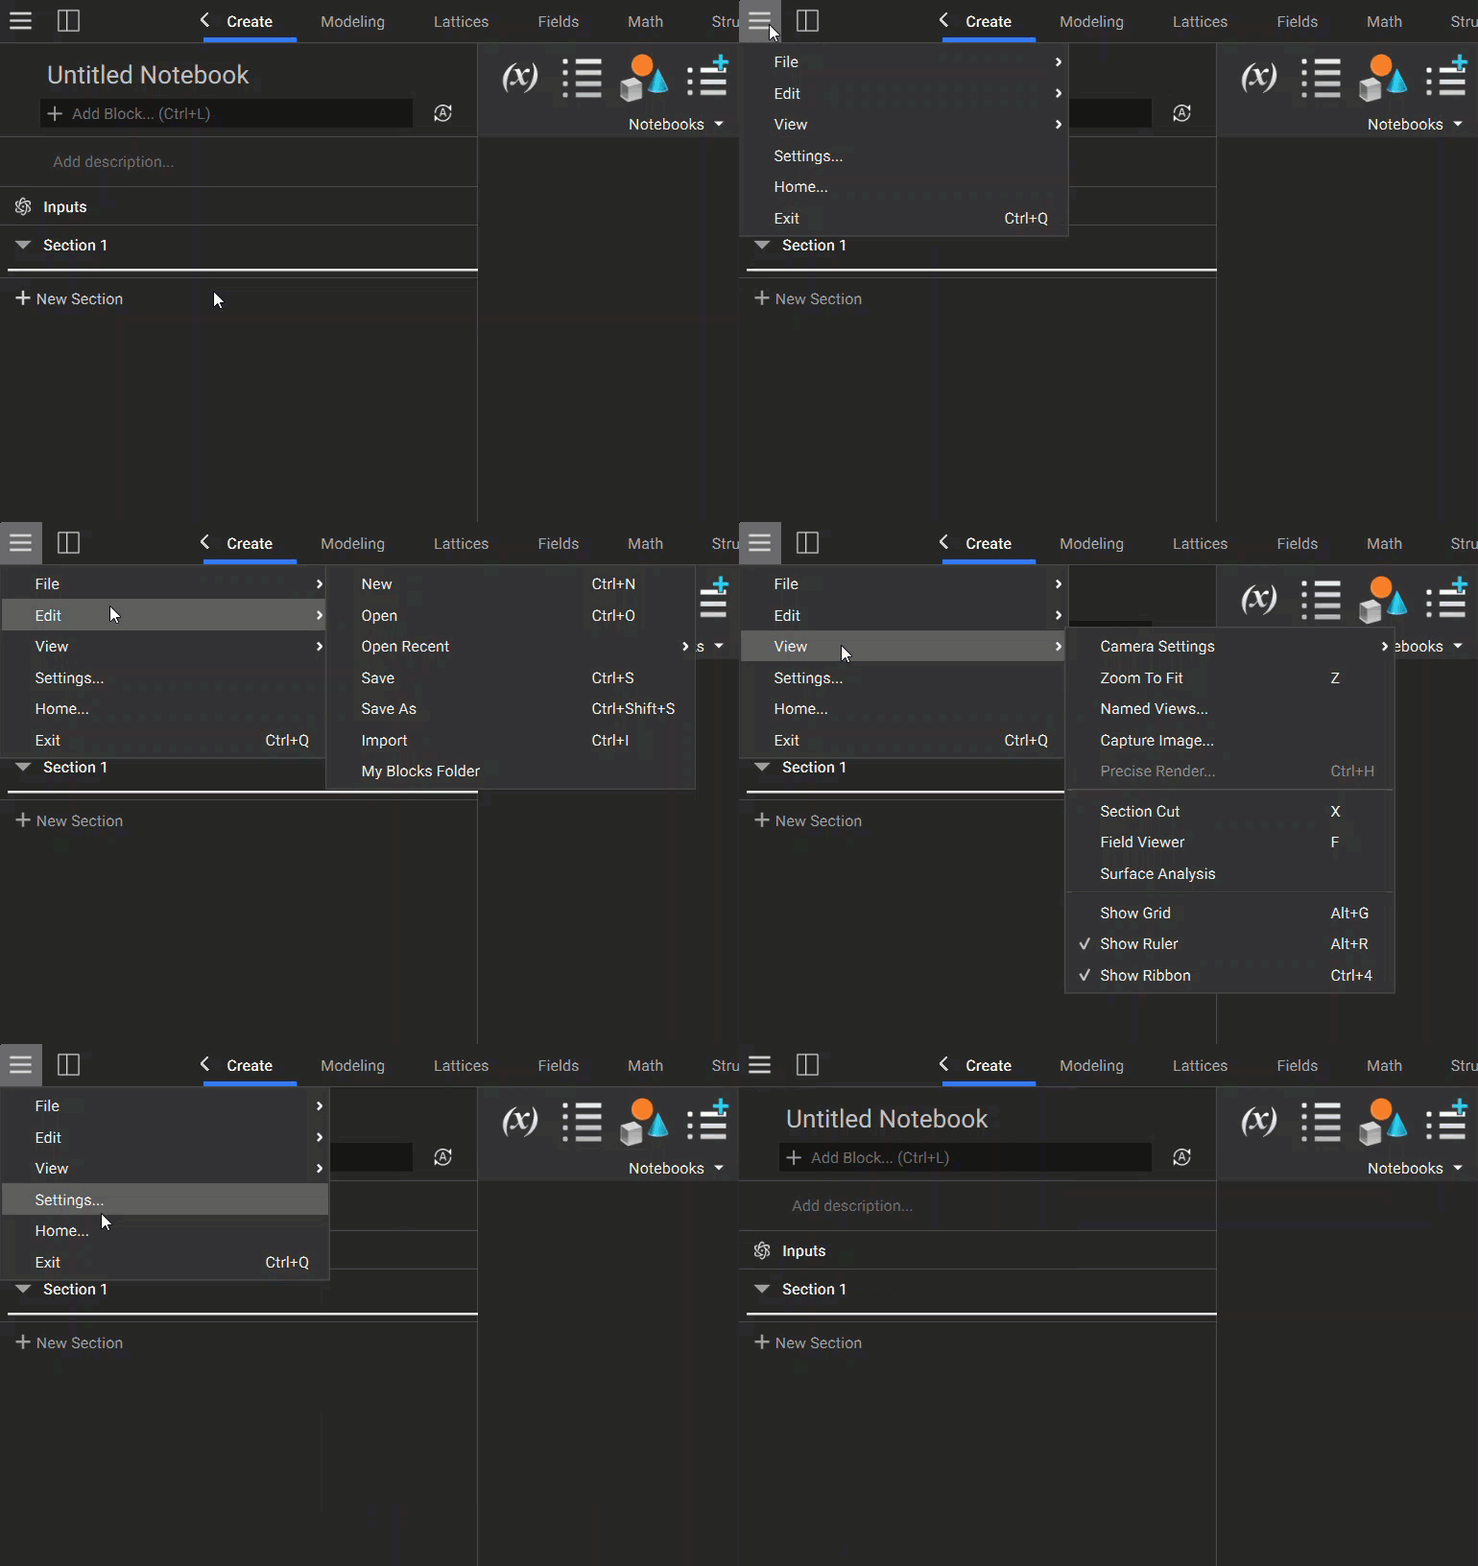
- File: Create/Open/Save files using the applicable options. The “Import” option is used to import custom blocks, and the “My Blocks Folder” opens the custom blocks folder.
- Edit: Undo/Redo/Cut/Copy/Paste/Paste with References are all available for operations performed in nTop. The “Select All Visible” option selects all geometry in a notebook.
- View: Contains options and settings for how geometry is presented in the viewport. This menu has some of the same options as the view cube, as well as some important additional controls. You can use Precise Render to generate an accurate still frame of your geometry and to take screenshots. The other tools that aren’t covered under view cube are explained in View Tools.
- Settings: Opens the nTop Settings menu. Here you can configure your nTop platform using the different settings tabs. This includes key settings like Show Beta blocks, Enable GPU acceleration, and configuring the ribbon. You can also change the global units for your workflows and customize display options.
- Home: Returns you to the nTop home page.
9. Left Side Panel
9. Left Side Panel
The Left Side Panel can be opened/closed by clicking the white/black rectangle icon next to the menu. This panel contains two tabs: Outline and Imports.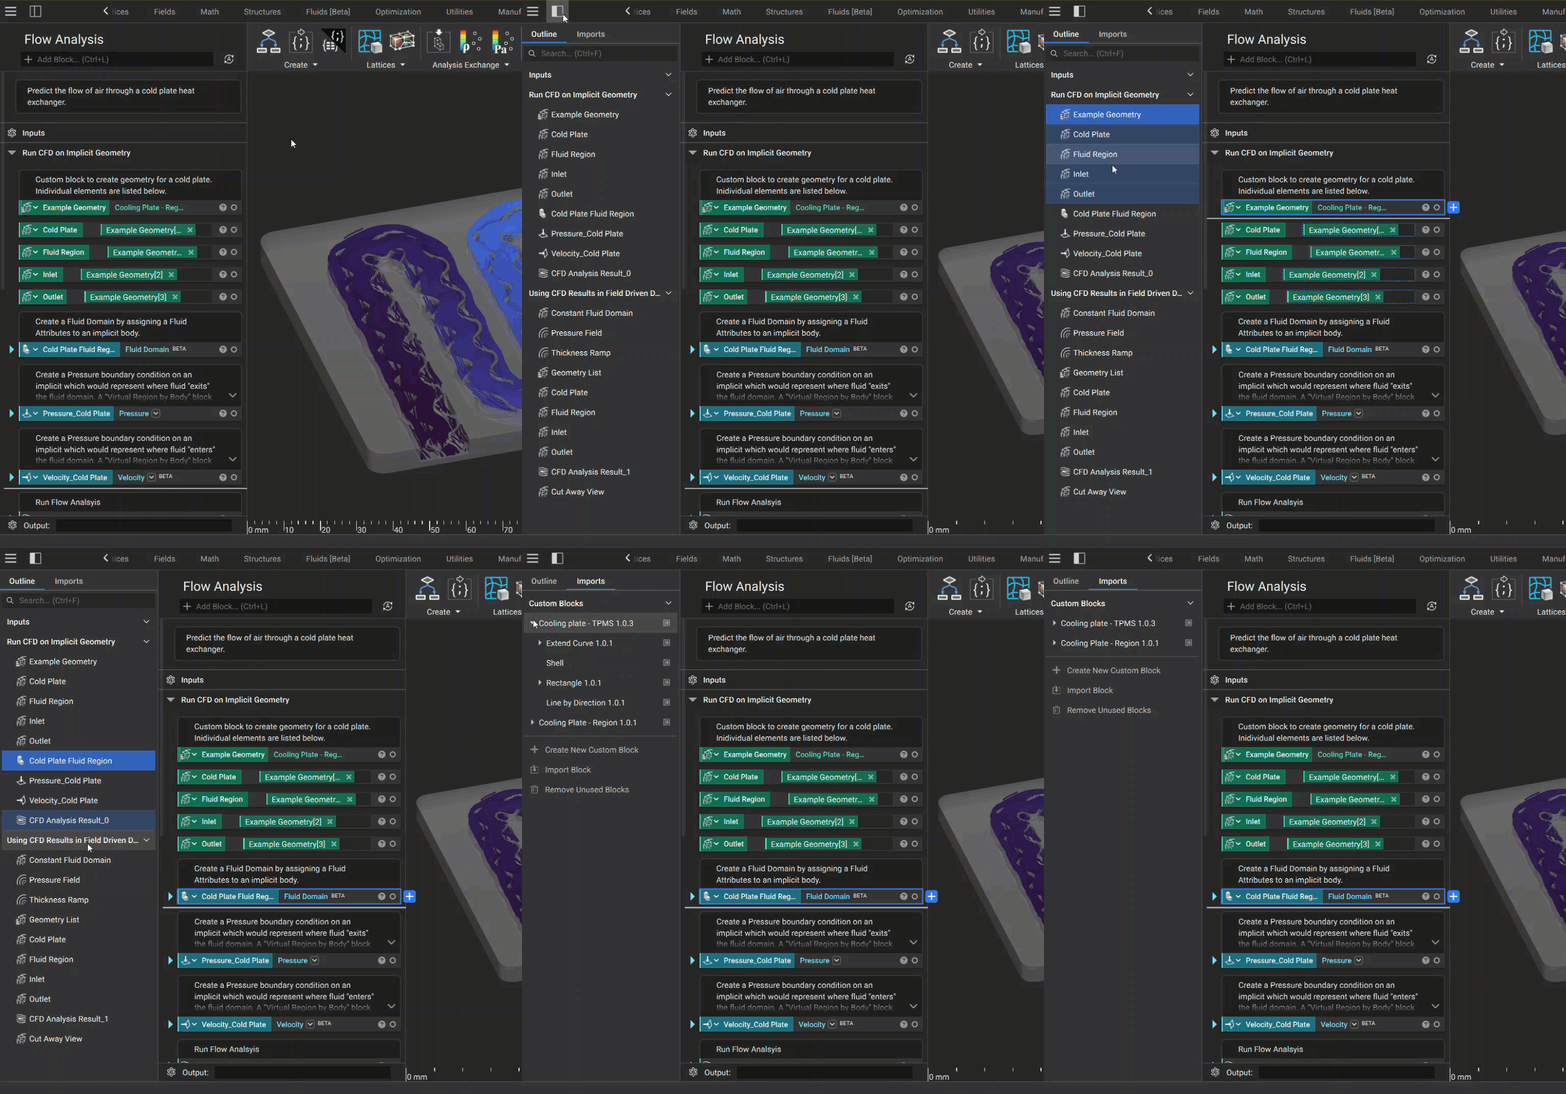
- Outline: The Outline is a list of all top level blocks in your notebook (i.e. It does not include blocks nested inside another block) that are separated by your notebook sections. When you select a block from the list, it is highlighted in bright blue. If this block is used downstream in another block, the parent block will be highlighted in a darker blue.
- Imports: The Imports tab is used to manage custom blocks in your workflow. Any custom blocks that have been imported will appear at the top under the Custom Blocks drop-down. You also have the options to create a custom block, import a custom block, and remove unused custom blocks that are not being used in your notebook or are outdated.
10. Right Side Panel
10. Right Side Panel
The Right Side Panel can be opened/closed by clicking the white/black rectangle icon in the top right corner of the nTop window. This panel contains three tabs: Information, Display, and Tools.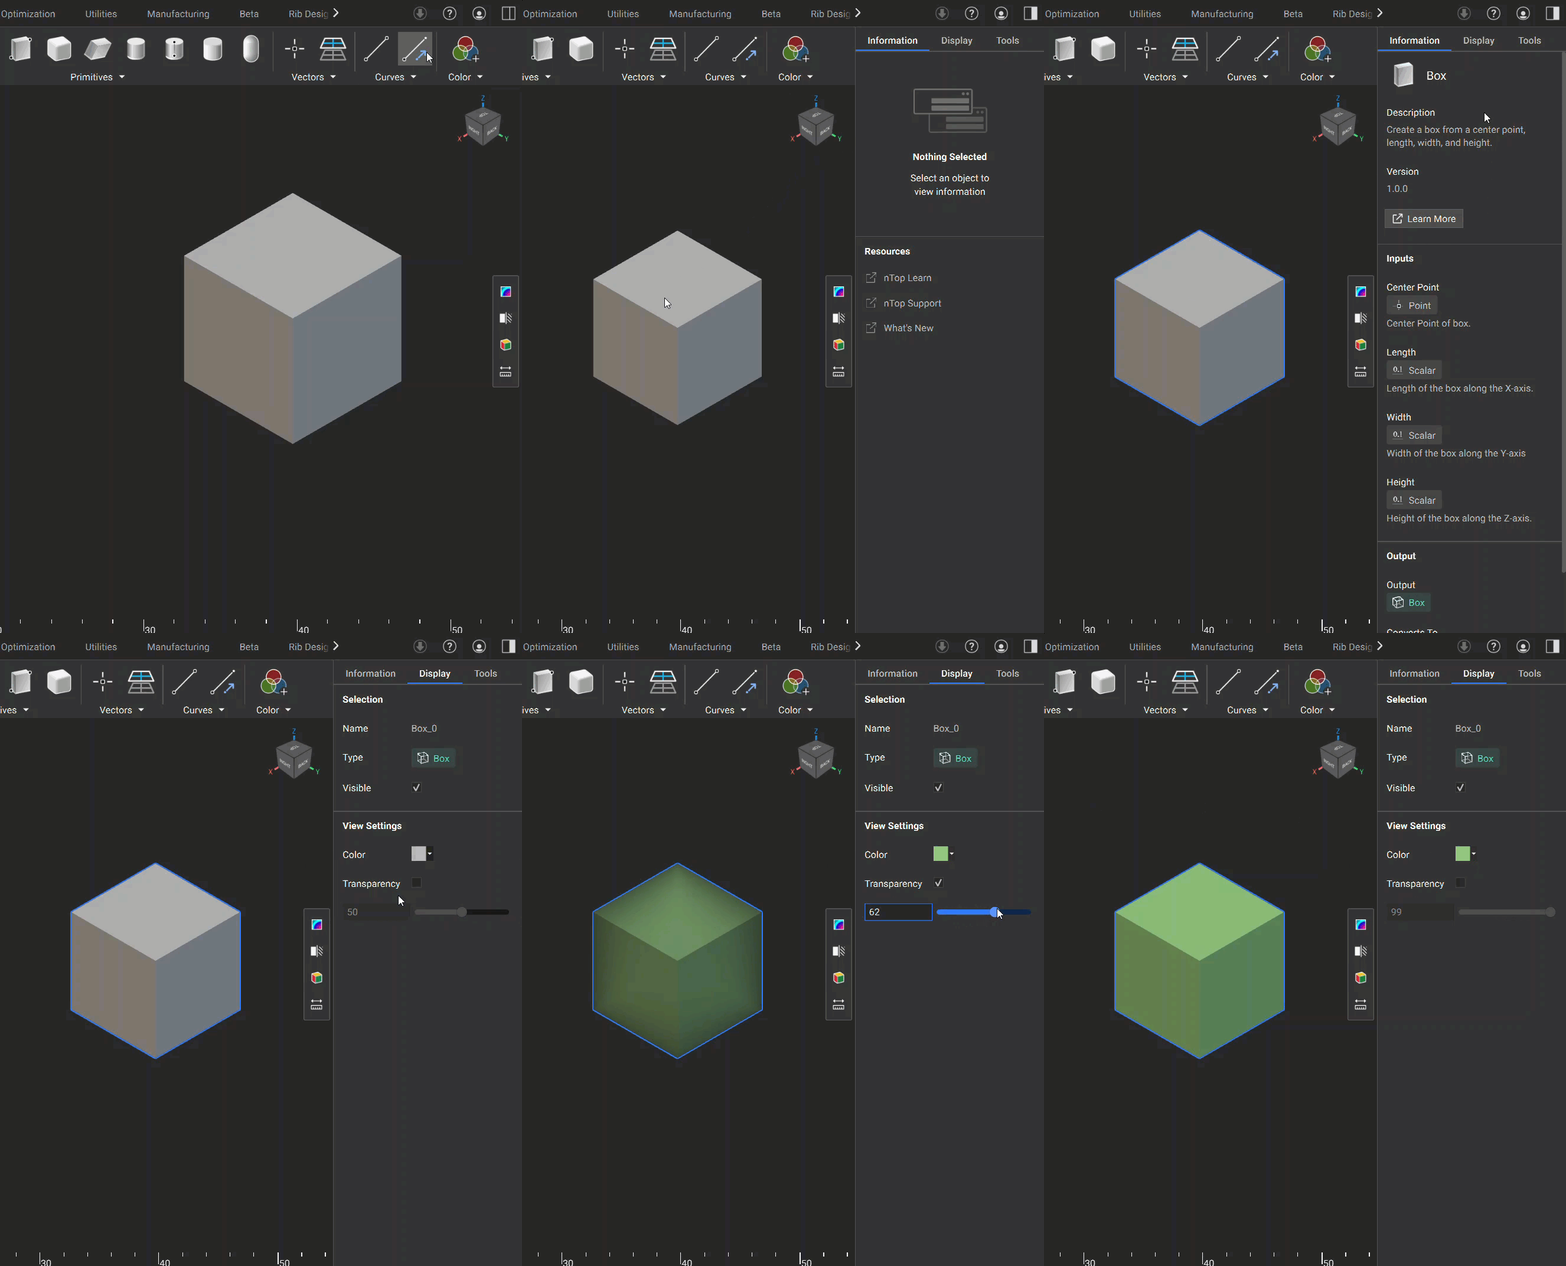
- Information: Displays block information based on which block is selected. Here you can see the block description, input descriptions, and output information. There is also a Learn More button that will open the selected block’s documentation file for more information.
- Display: Contains options for changing the selected body’s appearance using color and transparency.
- Tools: This tab is covered under View Tools.
11. In-App Options
11. In-App Options
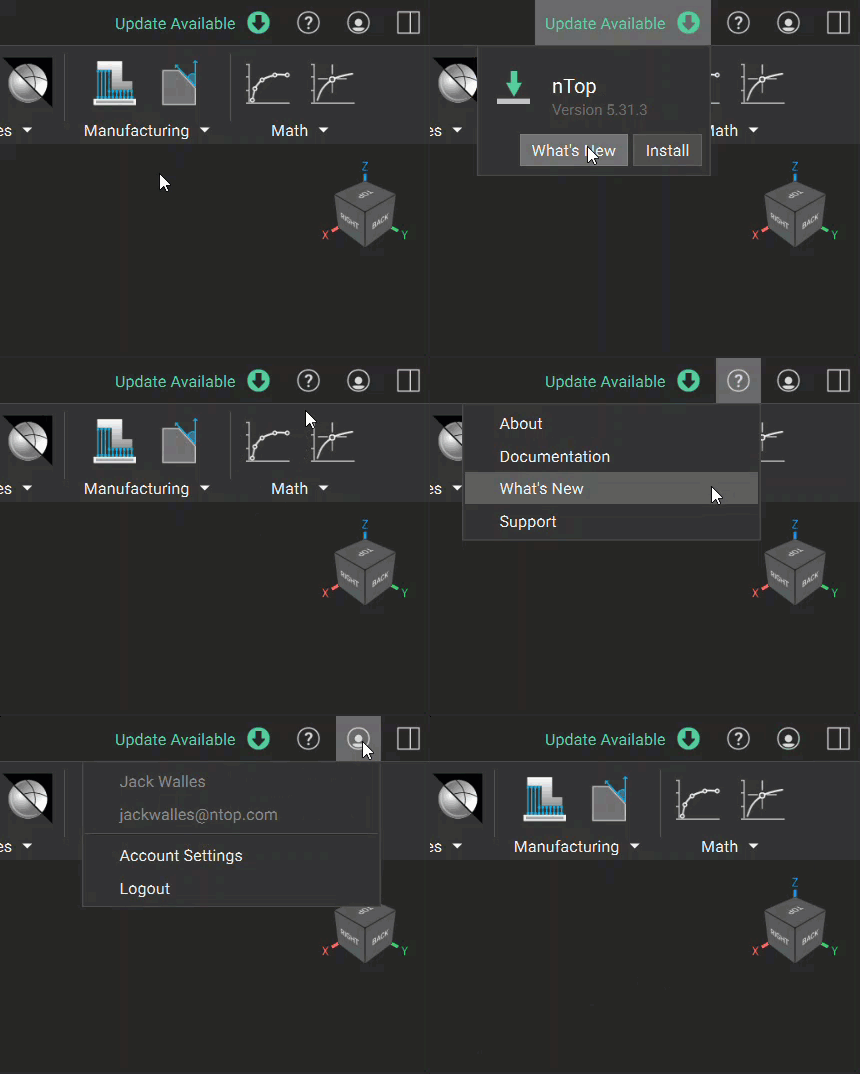
- Update Button: If you are not working in the latest version of nTop, you will see Update Available followed by a green download symbol. If you are on the latest version, the download symbol will appear gray.
- Information Button: The question mark icon contains:
- About: Information regarding your current software version.
- Documentation: Opens the nTop internal documentation
- What’s New: Opens the most recent release notes for the current software version
- Support: Opens the nTop Support site. This contains helpful articles, release notes, installation information, and more.
- User Icon: Shows user information and a link to access Account Settings. This also contains a Logout option.
12. View Tools
12. View Tools
The View Tools sidebar contains several helpful tools for analyzing your geometry: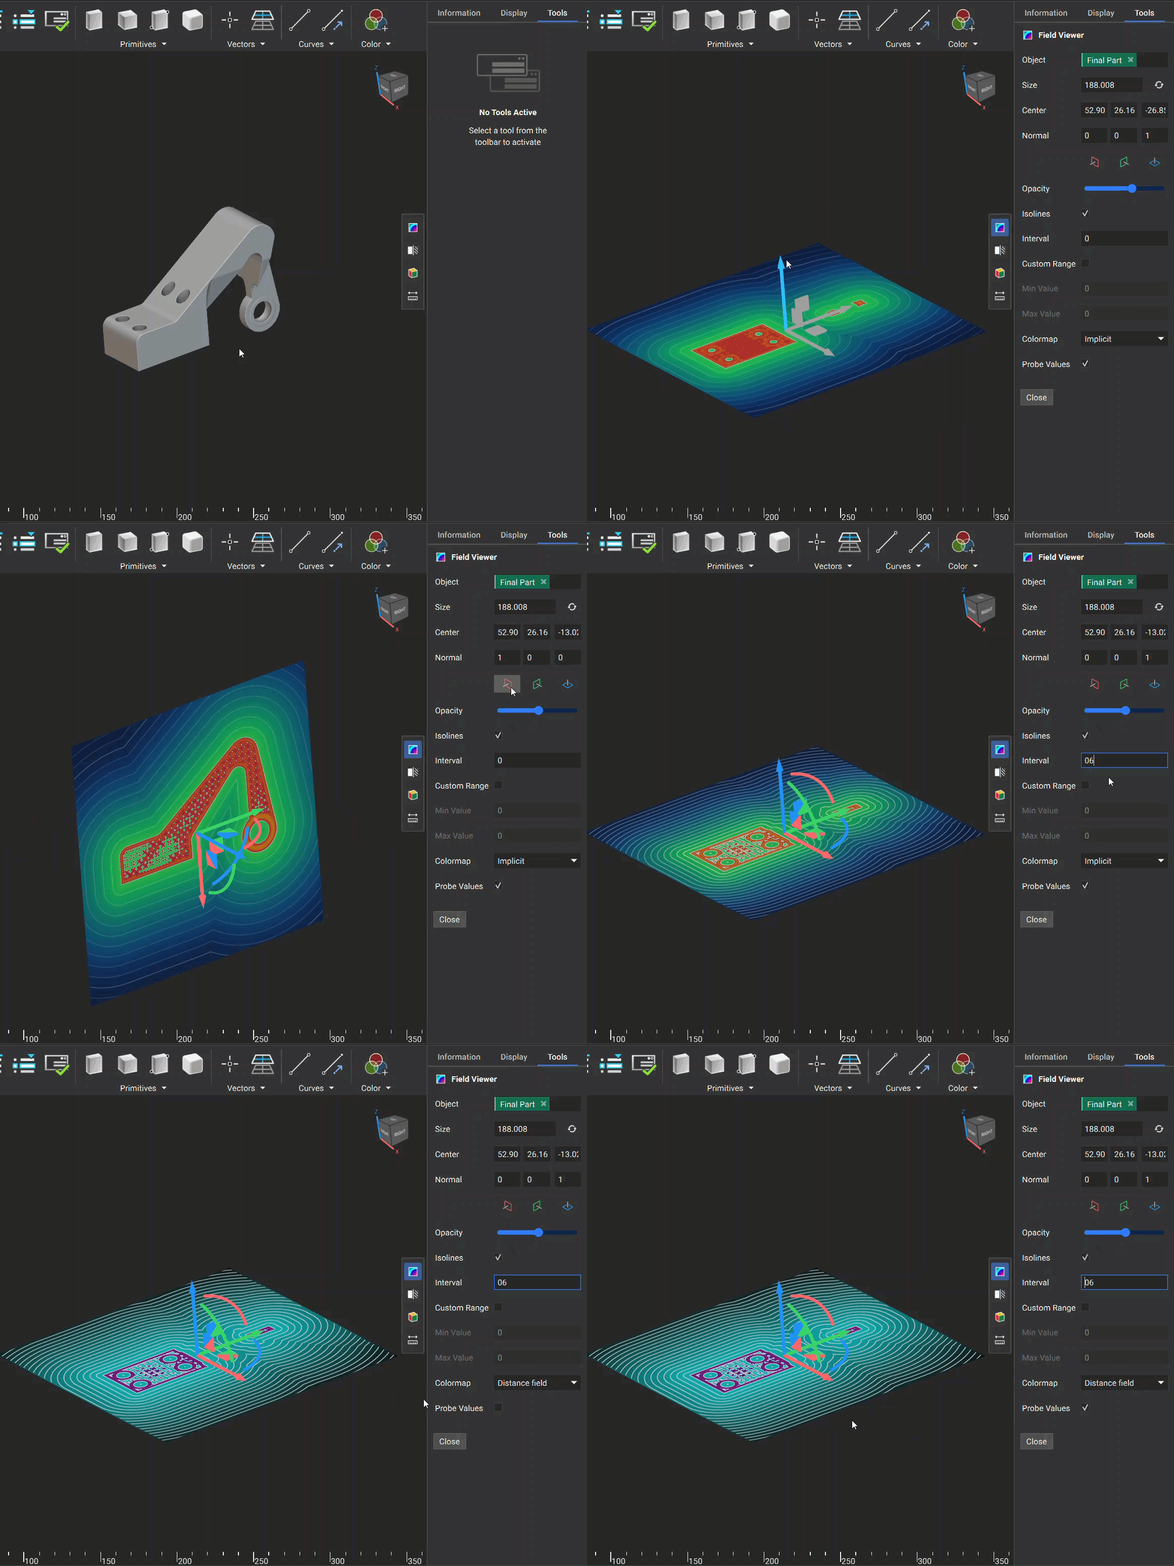
- Field Viewer: The Field Viewer allows you to visualize a field. You can change the plane of visualization using the colored plane icons. The following options are available to analyze the field:
- Opacity: Changes the opacity of the visualized field
- Isolines: Option to turn on/off the isolines
- Interval: Changes the spacing between the isolines
- Custom Range: Option to manually specify the value range of the field
- Min Value: Minimum value when a Custom Range is applied
- Max Value: Maximum value when a Custom Range is applied
- Colormap: Option to change the color scheme of the field
- Probe Values: Toggles the ability to see field values when moving the mouse over the field
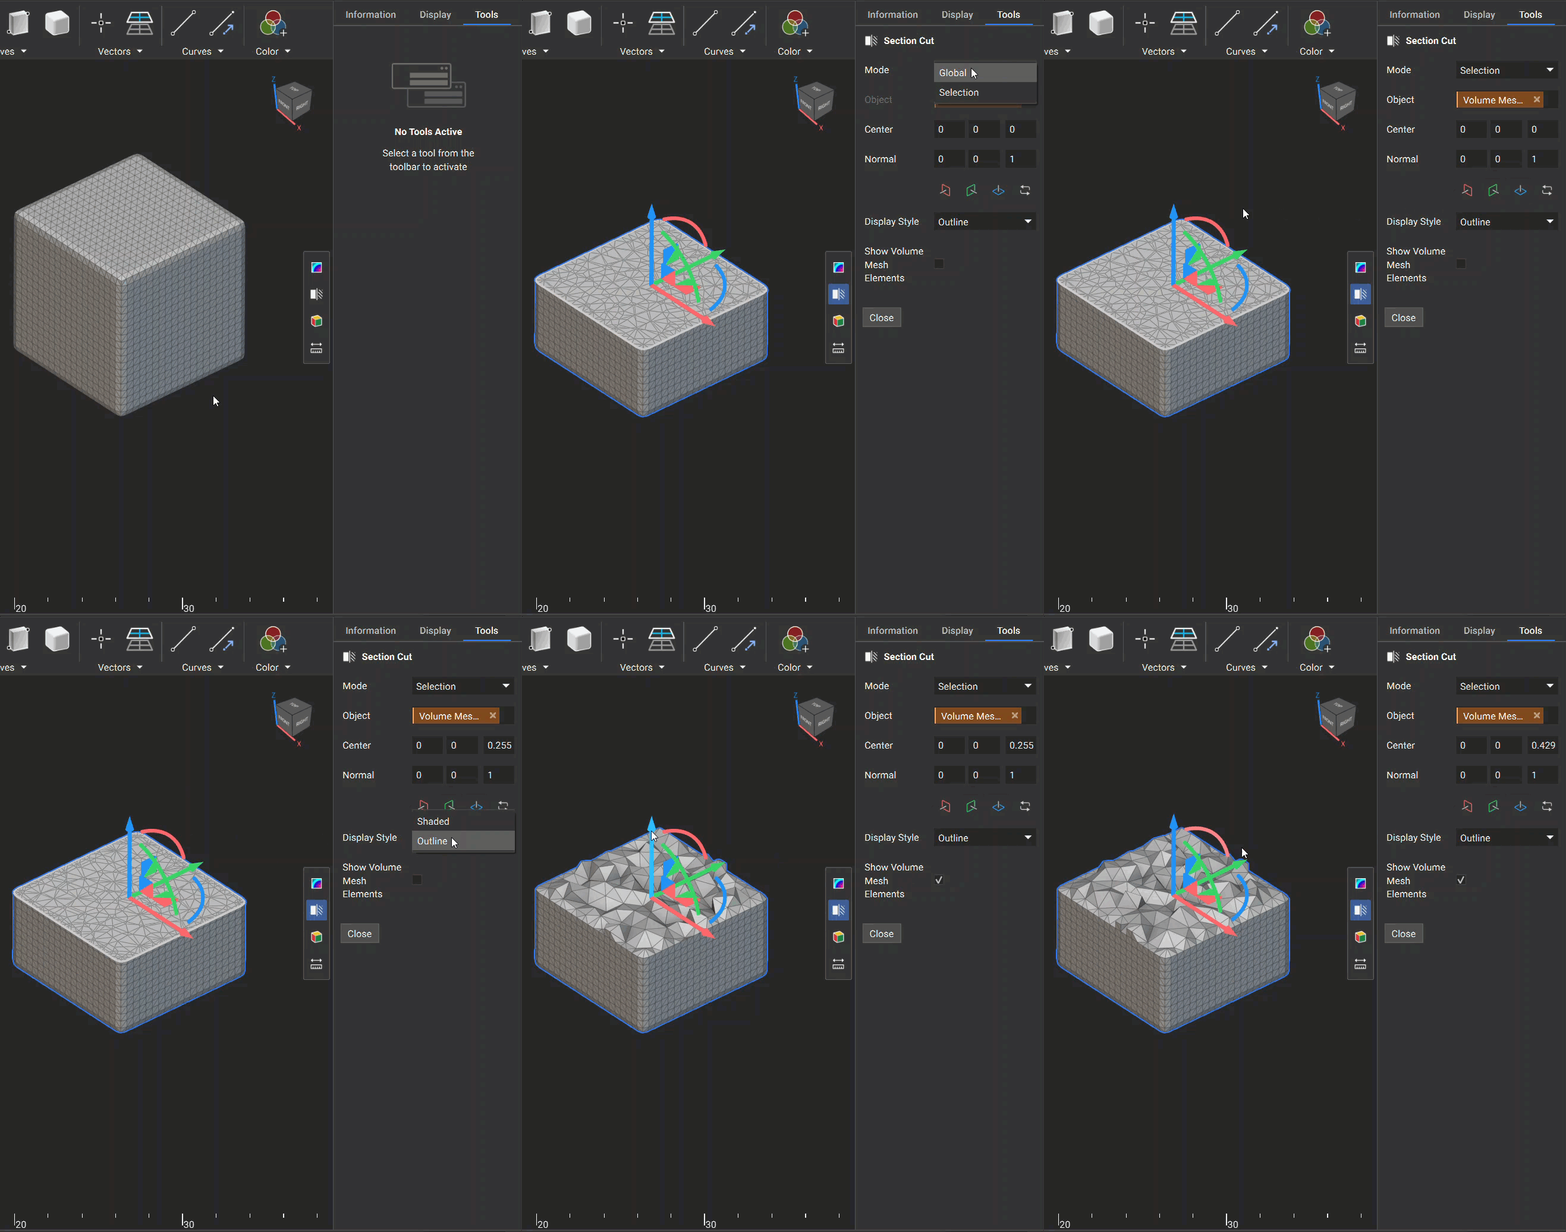
- Section Cut: This tool is used to cut geometry at a specified plane. You can change the plane of visualization using the colored plane icons. The following options are available when performing a section cut:
- Mode: Choose between performing a section cut on a specific body (Selection) or on all visualized bodies that intersect the plane (Global)
- Display Style: Changes the display style of the sectioned body
- Show Volume Mesh Elements: If the body is a volume mesh, you can toggle the visualization of the 3D internal volume elements
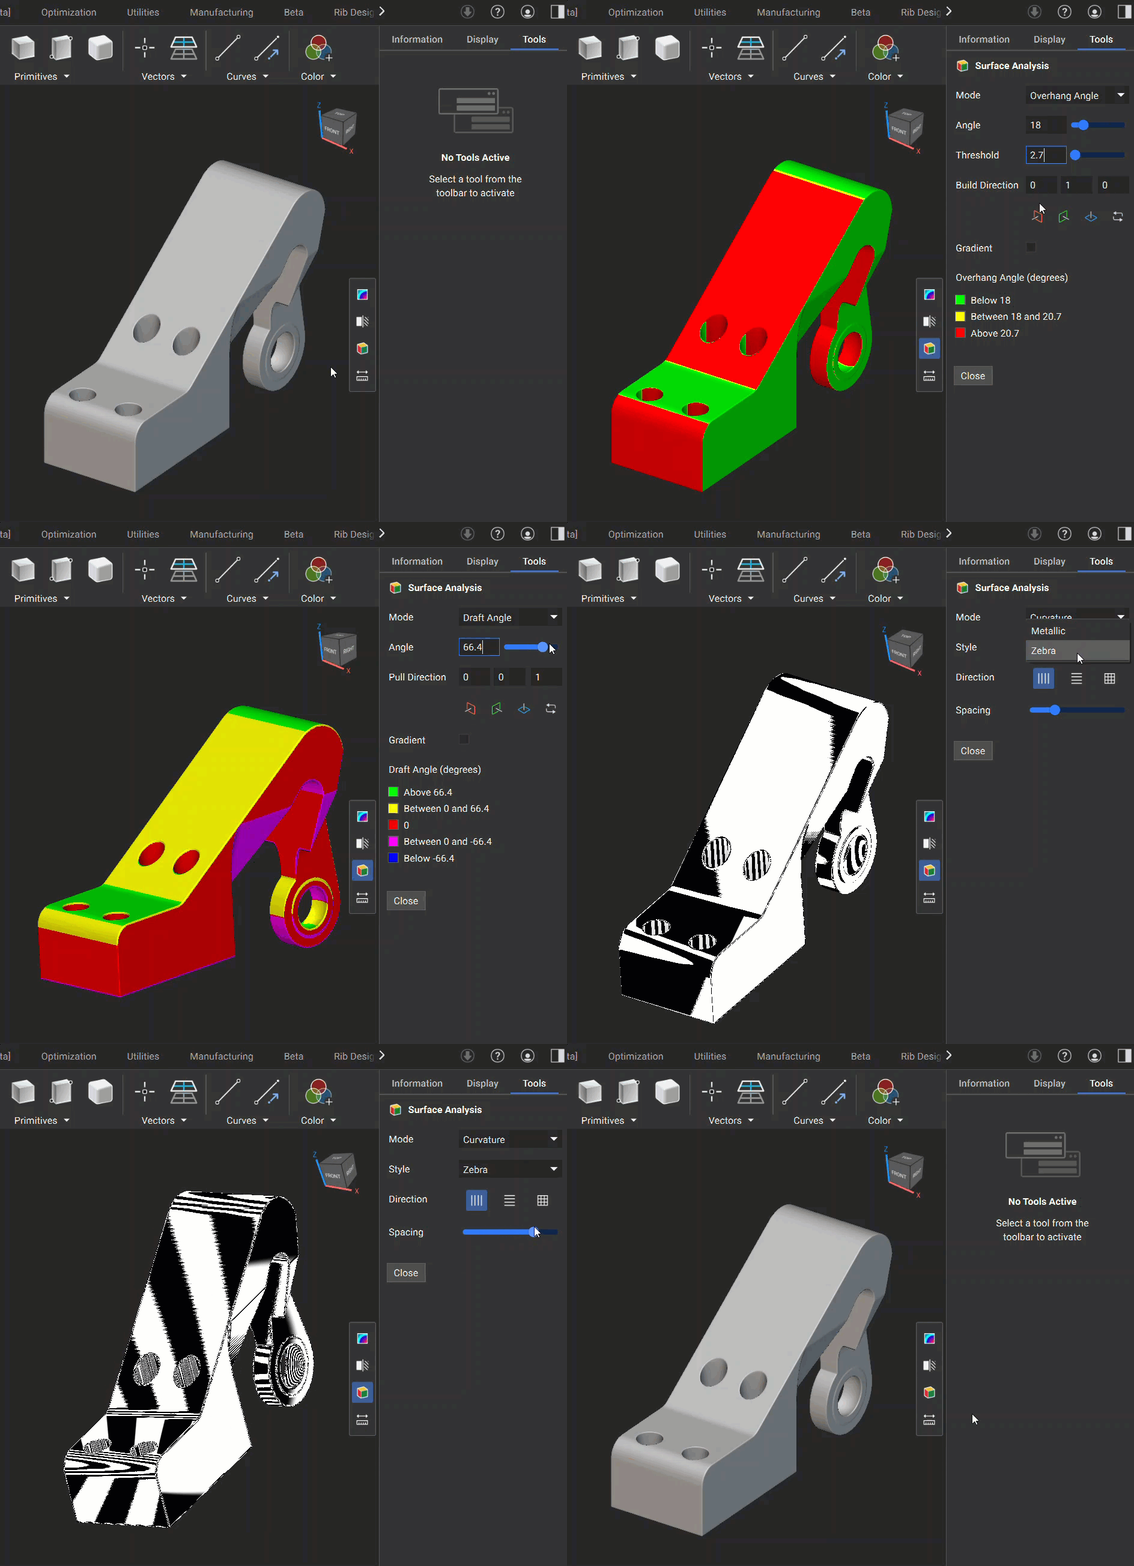
- Surface Analysis: The Surface Analysis tool has three different modes you can use to analyze the surface of your geometry:
- Overhang Angle: This mode is used to identify regions in your model where angles may exceed the printable threshold, helping you inspect the design for additive manufacturability. It has the following options for inspection:
- Angle: The lower value of the angle analysis
- Threshold: The range between the lower and upper angle values being evaluated
- Build Direction: Specifies the build plane normal direction
- Gradient: Option to display the color scheme as gradient or not
- Draft Angle: This mode visualizes areas of your model based on a specified draft angle relative to a pull direction, helping you verify that your design meets manufacturability requirements. It has the following options for inspection:
- Angle: The specified angle to evaluate the geometry
- Pull Direction: The plane used to specify the angle relative to the geometry
- Gradient: Option to display the color scheme as gradient or discrete
- Curvature: This mode is used to analyze the curvature of a geometry’s surface.
- Metallic: Renders the geometry with a shiny, reflective surface, which improves the clarity of curvature and surface quality.
- Zebra: Displays a series of alternating black and white stripes on a surface. The reflection patterns of these stripes help visualize the surface’s curvature. You can select from three buttons to choose the orientation of the stripes and use a slider to adjust their spacing.
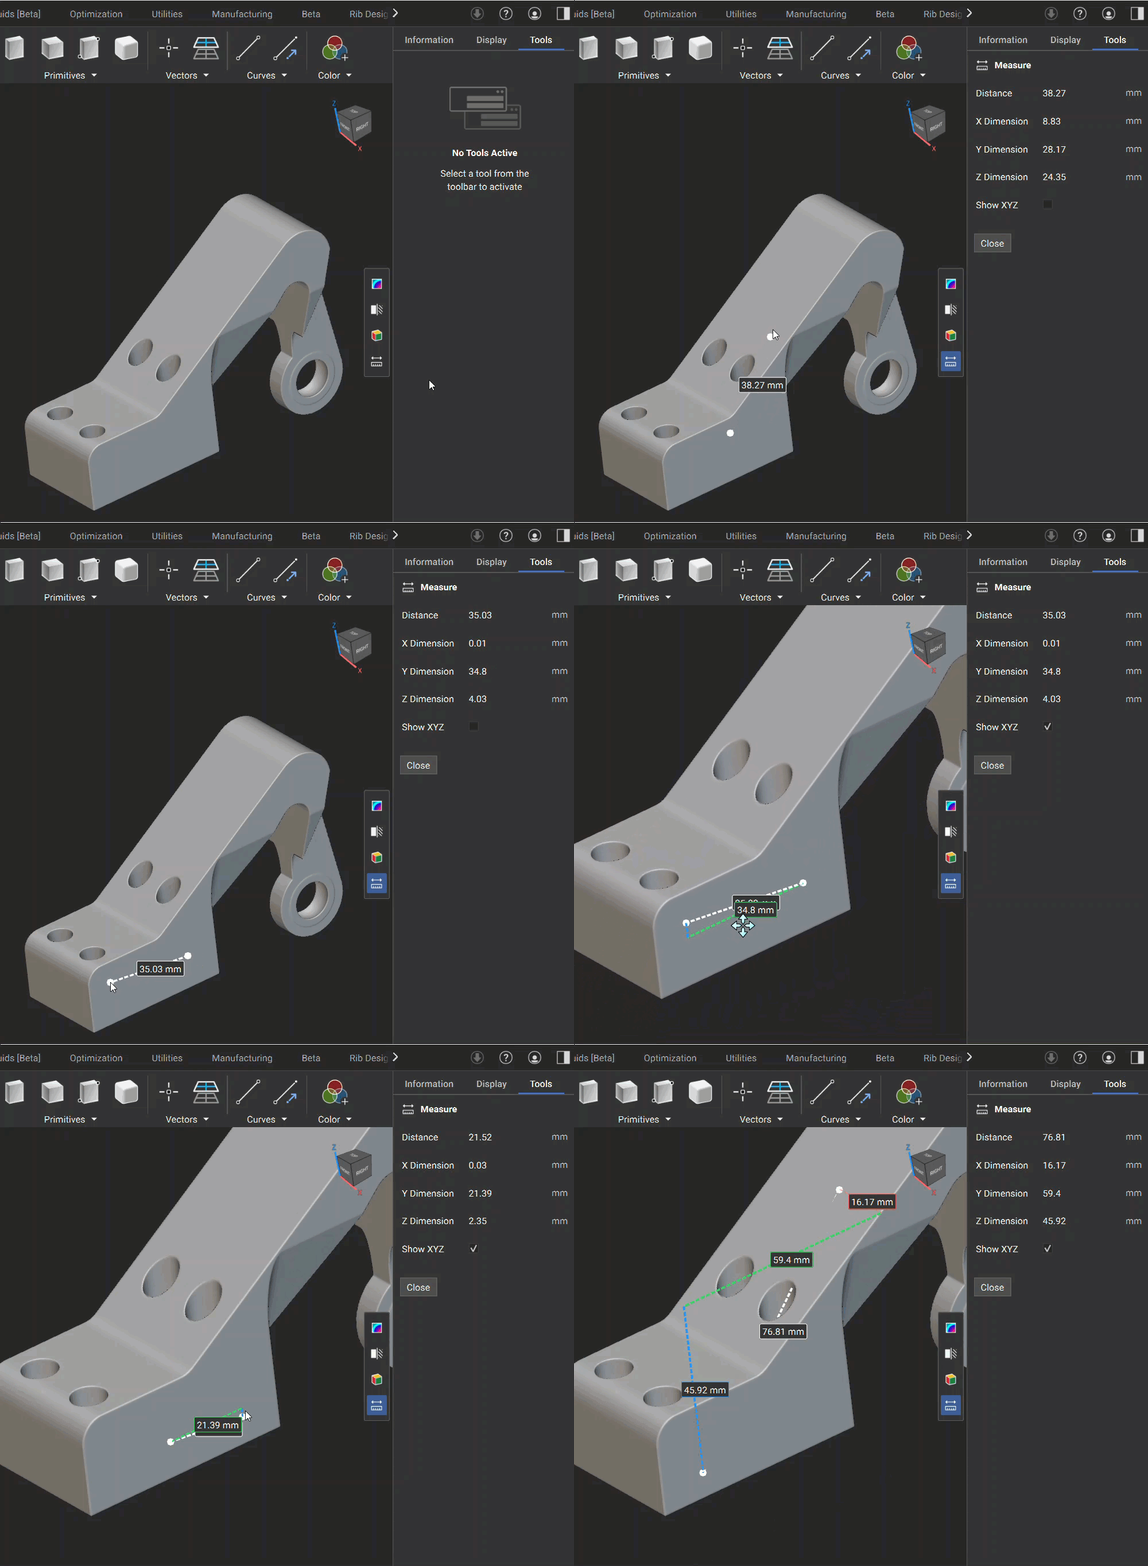
- Measure: The Measure Tool lets you directly measure distances between two points within your 3D model. This feature is ideal for quick inspections and supports interactive visualization of distances along global X, Y, and Z axes. The total distance and XYZ dimensions appear in the Right Side Panel, and you can check the “Show XYZ” checkbox to display dimension lines for X, Y, and Z in the 3D view.
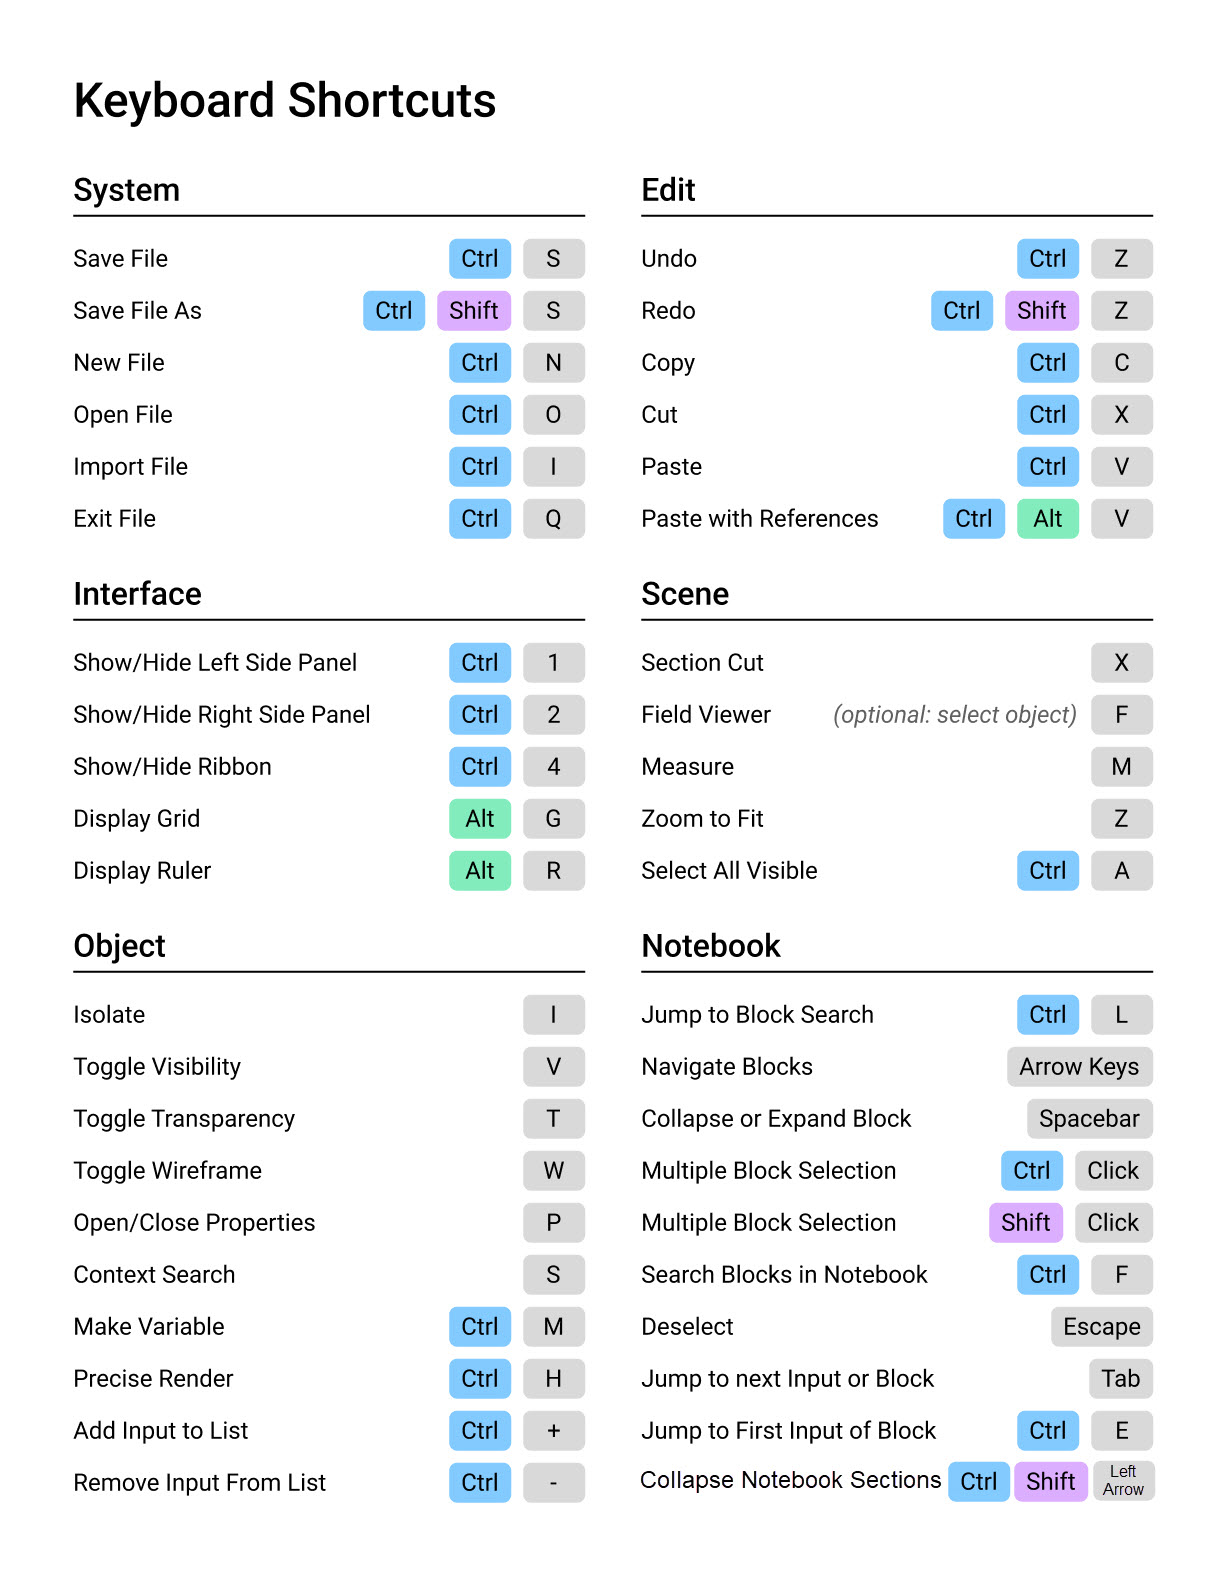
13. Controls and Shortcuts
13. Controls and Shortcuts
Transcript
Transcript
To help you get the most out of nTop, we will introduce the controls and tools for manipulating the model view, as well as useful keyboard shortcuts. In our software, you can zoom in and out using the mouse scroll, or by holding control and right-click. To orbit around the center of the object, right-click and hold. To pan, click on the scroll wheel and hold, or hold shift and right-click.
You can also adjust your view using the view cube. The view cube is completely interactive, and you can orient your views with a click on a labeled face, edge, or corner and rotate your object either counterclockwise or clockwise by using these arrows.
There are two different camera settings you can explore: orthographic, which is the default setting, and perspective. When you are in orthographic view, objects don’t have depth. For example, from whichever view or angle we’re in, these two tires will look to be about the same size no matter how close or far away we are from them. While you’re in this view, you can use the ruler at the bottom to roughly measure any features of the part. If you’re working on something like a small screw or bolt on this tire, you might experience something called the CAD goggles where you zoom in too far and lose sense of how big things are. But with perspective view, it gives the effect that the farther away the object is, the smaller it will look and vice versa, so it gives you a better sense of depth and helps you avoid CAD goggles. In this perspective, you can also zoom in, fly through these small holes, and work on small detailed areas of the model.
There are also two different rotational styles: the turntable and tumbler. Right now we have the tumbler selected, and we can move and rotate the model to view it at an arbitrary angle. If you choose to use the turntable, the model’s axes will always remain pointing up and down on the screen, and the camera will not be able to rotate all the way around the object.
Let’s move on to keyboard shortcuts. Useful hotkeys and keyboard shortcuts in nTop can be categorized into ones that are for views, blocks, or for working with files. Let’s start with the keyboard shortcuts you can use when you’re manipulating your views in nTop. You can find all your viewing tools on the menu bar at the top left under View and their keyboard shortcuts associated with them. While working with your model, there might be times when you lose sight of your part or while working zoomed in too far. You can reset the view by pressing Z on the keyboard to bring your part back into view at a reasonable distance.
Make sure the Block’s visibility is toggled on when using the zoom to select it. You can toggle the visibility of a Block on and off by pressing V on the keyboard while the Block is selected. To turn on the display grid, press Alt and G together on the keyboard. To do the same for the ruler that’s located at the bottom, use Alt R. To see this section cut view of a part, select the part you want to cut, press X on the keyboard, then determine your location and orient the plane. To open up the field viewer, select the Block and press F on the keyboard. Toggle off the visibility of your Block, and you’ll be able to see the field of the implicit body that you’ve selected. To see a precise high resolution render of the part or to do a high resolution image capture, use Control H.
Next, we’ll go over the shortcuts you can use while working with blocks. To be able to quickly search for blocks you need, use Control L as a shortcut to the search bar. When importing a part, rather than searching for an Import Block, you can also press Control I on the keyboard to open up your files from which you can choose what you’d like to import. To isolate the view of a Block, select the Block, press I on the keyboard, and this will turn off the visibility of all other blocks in the notebook.
You can select multiple blocks at the same time by holding control and left-clicking. This will highlight them in blue. For any blocks that have their visibility toggled on, pressing Control and A will select all those blocks. To collapse or open any Block, instead of clicking on the dropdown, you can press space bar on the keyboard after selecting the Block. You can create a variable by either right-clicking and choosing make variable or just simply by pressing Control M with the Block selected.
To copy a Block or blocks, you can select by left-clicking on it or by holding control and selecting multiple blocks. With those blocks selected, either right-click and choose copy selection or press Control + C on the keyboard, or under edit, select copy. You can paste both within the same or different instance of nTop. When you’re pasting within the same instance, the pasting is much like duplicate. It’ll create a copy of the Block, but with the pasting option, you can paste it anywhere in the root of the notebook or in the input of a Block. When pasting, you’re given two options: paste and paste with references. If you’re simply pasting a Block in another notebook, external references associated with that Block will not carry over. When pasting with references, however, any variables associated with that Block will be brought over as well.
The last few shortcuts are for when you’re working with your nTop file. All the file tools are under the File dropdown in the menu bar and these are labeled with their keyboard shortcuts. While working, don’t forget to save your file by pressing Control S on the keyboard. If you want to create a new nTop file, use Control N. To open an existing nTop file, use Control O and select the nTop file you would like to open. You can change the name of a file or make a duplicate by using Control Shift S together to save as. And lastly, once you’re done using nTop, press Control Q to quit.